Download
1 / 1
10 likes | 77 Views
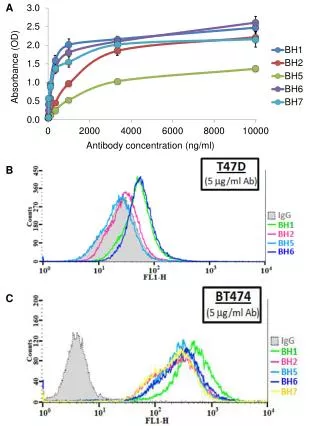
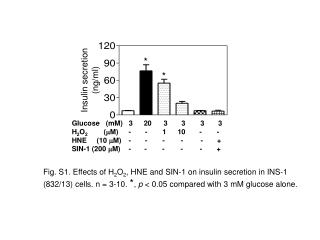
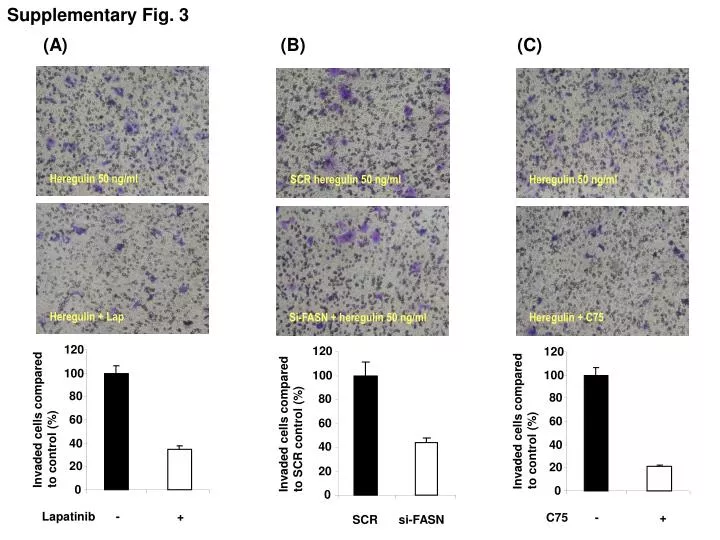
Supplementary Fig. 3 depicts the percentage of invaded cells compared to the control group at various treatment conditions including Lapatinib, C75, and Heregulin. The data is presented in graphs (A), (B), and (C) showing the impact of SCR control, si-FASN, and Heregulin+ treatments, along with their combinations. The experiments were conducted with Heregulin at 50 ng/ml concentration. The results reveal the varying invasion rates under different treatment scenarios.

E N D
Supplementary Fig. 3 120 120 100 100 80 80 Invaded cells compared to control (%) Invaded cells compared to control (%) 60 60 40 40 20 20 0 0 Lapatinib -+ C75 - + 120 100 80 Invaded cells compared to SCR control (%) 60 40 20 0 SCR si-FASN (A) (B) (C) Heregulin 50 ng/ml SCR heregulin 50 ng/ml Heregulin 50 ng/ml Heregulin + Lap Si-FASN + heregulin 50 ng/ml Heregulin + C75