Download
1 / 1
10 likes | 74 Views
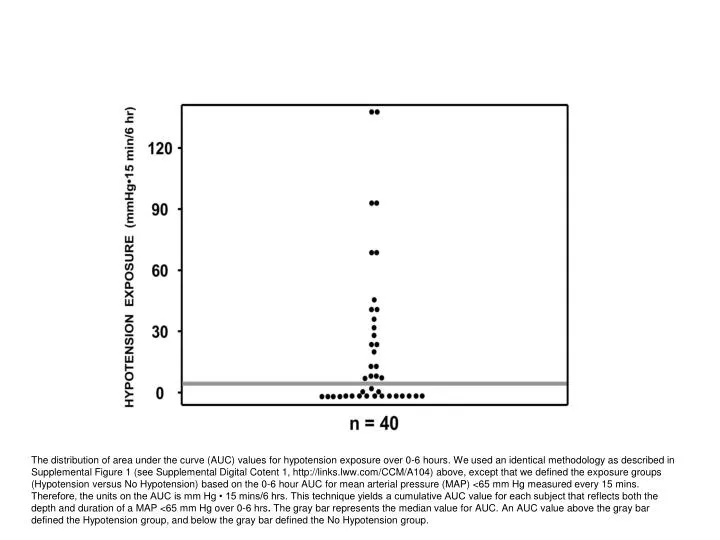
This study analyzes AUC values for hypotension exposure using MAP <65 mmHg over 0-6 hours. Identical methodology was followed as in Supplemental Figure 1, defining exposure groups based on MAP levels. The cumulative AUC value for each subject reflects the depth and duration of hypotension.

E N D
The distribution of area under the curve (AUC) values for hypotension exposure over 0-6 hours. We used an identical methodology as described in Supplemental Figure 1 (see Supplemental Digital Cotent 1, http://links.lww.com/CCM/A104) above, except that we defined the exposure groups (Hypotension versus No Hypotension) based on the 0-6 hour AUC for mean arterial pressure (MAP) <65 mm Hg measured every 15 mins. Therefore, the units on the AUC is mm Hg • 15 mins/6 hrs. This technique yields a cumulative AUC value for each subject that reflects both the depth and duration of a MAP <65 mm Hg over 0-6 hrs. The gray bar represents the median value for AUC. An AUC value above the gray bar defined the Hypotension group, and below the gray bar defined the No Hypotension group.