Download

1 / 15
150 likes | 287 Views
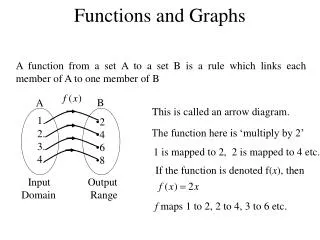
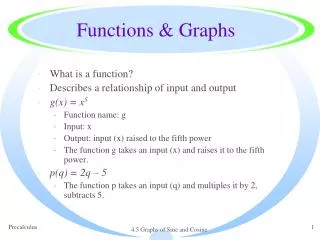
Functions & Graphs. LINEAR & QUADRATIC GRAPHS. Graph the function f: x 2x + 1 for –1 x 5. f(x) = 2x + 1. Now match up your x and y values (-1, -1 ) ( 0, 1 ) ( 1 , 3 ) ( 2 , 5 ) ( 3 , 7 ) ( 4 , 9 ) ( 5 , 11 ). If f(x) = 4x – 5 , find

E N D
Functions & Graphs LINEAR & QUADRATIC GRAPHS
f(x) = 2x + 1 Now match up your x and y values (-1, -1 ) ( 0, 1 ) ( 1 , 3 ) ( 2 , 5 ) ( 3 , 7 ) ( 4 , 9 ) ( 5 , 11 )
If f(x) = 4x – 5 , find • f(2) (ii) f(0) (iii) f(-3) • f(2) = 4(2) – 5 f(0) = 4(0) – 5 f(-3) = 4(-3) - 5 • = 8 – 5 = 0 – 5 = - 12 - 5 • =3 = - 5 = - 17
If f(x) = 4x – 2 , Solve the following equations • f(x) = 10 (ii) f(x) = 22 • 4x – 2 = 10 4x – 2 = 22 • 4x = 12 4x = 24 • x = 3 x = 6
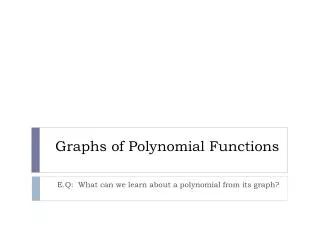
Quadratic Graphs Draw the graph of the function f(x) = x2 + x – 6 - 4 x 3
f(x) = 0 -3 2 For what values of x does f (x) = 0 For f(x) = 0 x = - 3 or x = 2
f(x) = 4 -3.7 2.7 Find the values of x when f(x) = 4 For f(x) = 4 x = - 3.7 or 2.7
Draw the graph of the function f(x) = - 2x2 + 7x – 3 -1 x 4
2 Use your graph to find the value of f(2½) x = 2½ f(2½) = 2
f(x) = 0 0.5 3 Use your graph to find the values of x when f(x) = 0 x = 0.5 & x = 3
f(x) = - 3 0 3.5 Use your graph to find the value of x when f(x) = -3 x = 0 or 3.5