Download
1 / 115
1.16k likes | 1.35k Views
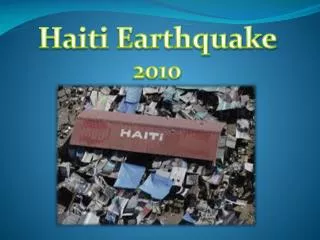
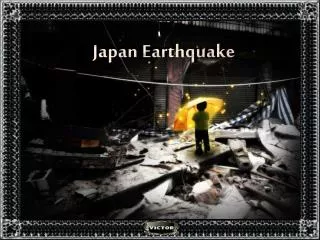
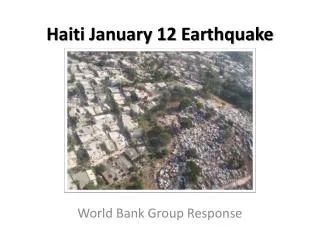
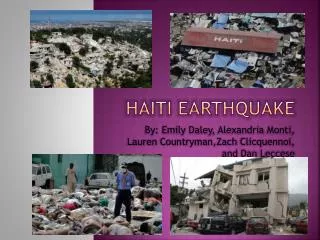
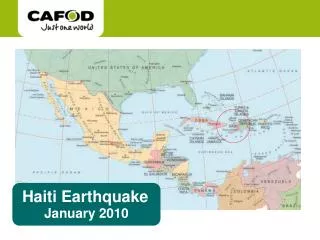
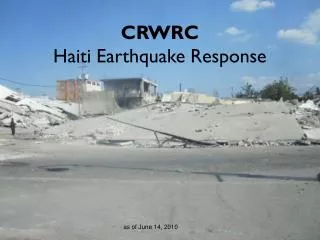
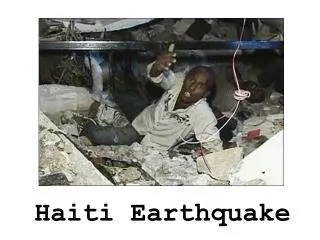
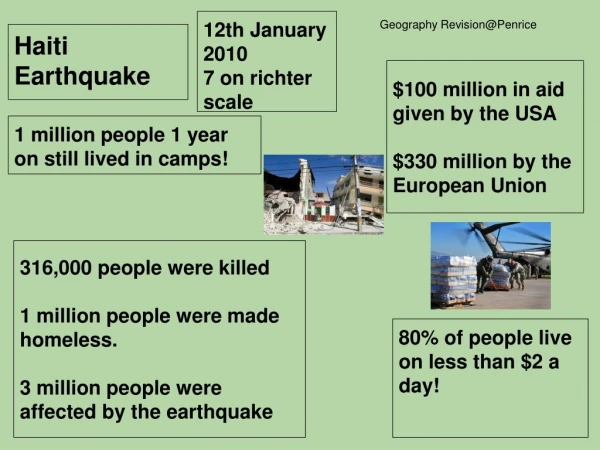
Haiti and Japan Earthquake Comparison. Magnitude Haiti-7.0 Japan-9.0 which caused a Tsunami Left Homeless Haiti- 1.5 million Japan- 1-2 million Death Haiti- 220,000 Japan- 15,000 Cost Haiti- $14 billion Japan- $230 Billion Additional Effects

E N D
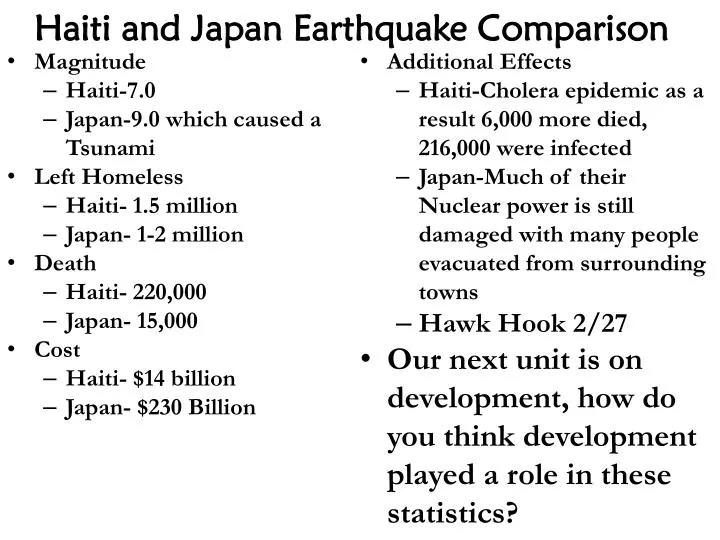
Haiti and Japan Earthquake Comparison • Magnitude • Haiti-7.0 • Japan-9.0 which caused a Tsunami • Left Homeless • Haiti- 1.5 million • Japan- 1-2 million • Death • Haiti- 220,000 • Japan- 15,000 • Cost • Haiti- $14 billion • Japan- $230 Billion • Additional Effects • Haiti-Cholera epidemic as a result 6,000 more died, 216,000 were infected • Japan-Much of their Nuclear power is still damaged with many people evacuated from surrounding towns • Hawk Hook 2/27 • Our next unit is on development, how do you think development played a role in these statistics?
Development: Models of Economic Growth, Diffusion, and World Variations
Basic Development Info • Definition of Development: process of improving the material conditions of people through diffusing knowledge and technology • Continuous process of improvement • MDC’s: developed countries • LDC’s: developing countries
Human Development Index • UN measure of Development: level of development is a based on 3 indicators: economic, social, and demographic
Overview of HDI: • 1 Economic Factor: • Gross Domestic Product (GDP): the total value of goods and services produced in a country • 2 Social Factors: • Literacy Rate and Amount of Education (average # of school years attended) • 1 Demographic Factor • Life expectancy (average # of years a newborn can expect to live) • Highest Possible HDI is 1.0 or 100%
Current World Trends (Overview) • What country do you believe has the highest HDI? • Norway at .938 in 2010 • What country do you believe has the lowest HDI? • Zimbabwe at .140 • Where do you believe the 2 dozen lowest ranking countries were located? Why? • Sub-Saharan Africa
The US Situation • Ranked 4th • What do you believe accounts for this rank? • Near the top in GDP and Literacy • Lower in Education and Life Expectancy • High School Drop-out Rates and Inadequate Health Care for low-income people
5 Economic Indicators of Development • GDP • Types of Jobs Available • Productivity of workers • Access of raw materials • Availability of consumer goods • Goods purchased to satisfy immediate wants and needs • What are some examples?
Gross Domestic Product • Use per capita GDP (how much each person’s portion of the GDP is) • Figured by dividing GDP by population • EX: GDP = $100 and population = 10, then each person receives, on average, $10
Per Capita GDP MDC’s • Average per capita GDP in MDC’s $27,000 • Has increased 55% since 1990 ($10,000) • US: approx 40,000
Per Capita GDP LDC’s • Average per capita GDP in LDC’s: $4,000 • Has increased 450% since 1990 (bit under $4,000) • Not equal growth China huge changes, Africa few • 18 countries (15 in Africa, 3 in Asia) below $1000
Critical Thinking Question • Why is per capita GDP not an adequate measure of development on its own? • Measures average wealth not distribution • If few people hold all the wealth then standard of living for most lower than average would indicate
Types of Jobs Available • What are the 3 sectors of the economy? Where is each most prevalent?
Productivity of Workers • Productivity: value of a product compared to the amount of labor necessary to make it • Higher in MDC’s • Produce more with less effort • Why? • LDC’s rely more on human and animal labor
Access to Raw Materials • Includes access to minerals, trees, energy sources (oil, coal, natural gas, or uranium for nuclear power) • Indicates potential for Development not actual development
Critical Thinking Question • Using real world examples how can the availability of natural resources not be a perfect indicator of level of development? • Ex: Japan, Singapore, South Korea, and Switzerland have few natural resources but have become highly developed through trade • Much of Africa is rich in natural resources but lacks the infrastructure to be considered developed states
Historical Relationship btwn Resources and Development • Industrial Revolution • Occurred in countries rich in both natural resources and energy sources (Ex. UK) • Colonialism and Imperialism • Occurred to create steady supply of resources in resource depleted Europe • Sustained development in Europe, hindered it in Africa and Asia • Why is this flow a problem for development in the LDC’s?
Consumer Goods • Most important consumer goods to consider: transportation and communication technologies • Examples? • Why? • Transportation: access to jobs and distribution of products • Communication: telephones and computers enhance communication between suppliers, producers, and sellers
Consumer Goods and MDC’s versus LDC’s • How accessible are consumer goods to MDC’s? • Virtually all citizens • VITAL to business of tertiary and secondary jobs • How accessible are consumer goods to LDC’s? • Not as available • Not as important for subsistence living (creating just enough food to live with little extra)
Haves and Have-nots in the LDC’s • Access to consumer goods creates gap between the “haves” and “have-nots” in LDC’s • Typical Characteristics of Haves: • Higher Economic Status: government officials, business owners, elite classes • Live in urban areas (more variety of job opportunities requiring additional technology) • Have- Nots? • Usually rural areas engaging in primary sector work or simple services
Critical Thinking Question • How can transportation and communication technologies increase educational opportunities and leisure activities?
Reciprocal Relationship Btwn Economic and Social Development • Economic Development = Great Wealth • Spend portion of wealth on social services (schools, hospitals, welfare services) = Smarter, healthier, and secure workforce = more economic productivity
Education and Literacy • Measured by quantity and quality of education • Quantity: Number of years of schooling • Quality: student/teacher ratio and literacy rate • Education number one way to improve economy • Better education = highly qualified workforce = higher wages = better access to consumer goods = higher standard of living
MDC’s compared to LDC’s • Quantity • MDC’s = 10 years • LDC’s = 2-3 years • Student/Teacher Ratio • Twice as high in LDC’s • Literacy Rate • MDC’s = > 98% • LDC’s = < 60%
Health and Welfare, MDC’s • MDC’s: > 8% of GDP spent on healthcare • More doctors, hospitals, and nurses per capita • Most of Europe: private individuals responsible for 30% of their healthcare costs • Public assistance (unemployment compensation, welfare, etc) Greatest in North Western Europe (Norway, Sweden, Denmark)
Health and Welfare, LDC’s • LDC’s: <6% • Private individuals responsible for 50% of their healthcare • US exception: private individuals responsible for 55% of their healthcare costs
Critical Thinking Question • Why are MDC’s struggling to maintain their levels of public assistance? What choice are they facing? • Growing Elderly Population: more people to assist • Economic downturn cannot fund generous programs initially in place • Choice between reducing benefits or increasing taxes
FRQ Practice 3/5 • Complete Sentences: Resources and Development • How do resources relate to the development of a country? • How did resources influence the following: • Industrial Revolution • Colonialism/Imperialism • How has the availability of resources and history affected the following economies: • Japan • Africa
Demographic Indicators of Development:Reflection of Health and Education
Life Expectancy • LDC: 60’s • MDC: 70’s • What is the typical shape of the population pyramid for an LDC? • What responsibilities do the governments of these countries have? • What is the typical shape of the population pyramid for an MDC? • What responsibilities do the governments of these countries have?
Infant Mortality Rate • MDC’s: 99.5% survive • LDC’s: 94% survive • Result of: malnutrition after birth, lack of medicines and immunizations, lack of education of clean medical practices
Natural Increase Rates • LDC’s: 1.5% • Struggle to provide care for growing population • MDC’s: .01%
Crude Birth Rate • LDC’s: 24 per 1,000 • MDC’s: 11 per 1,000 • Why lower rates? • Access to birth control and social reasons in LDCs
Critical Thinking Question • Why does the Crude Death Rate not indicate a society’s level of development? • Diffusion of medical practices has reduced instances of diseases in LDC’s • MDC’s have a higher % of elderly
Regions of Development • 11 Regions based on Development • 5 Developed Regions • 6 Developing Regions • North-South Split: Almost all MDC’s exist above 30* N Latitude and LDC’s below • Exceptions: Australia in South, Part of Middle East and East Asia in North
Regions Overview • More Developed Regions • Anglo-America • Western Europe • Eastern Europe • Japan • South Pacific • Less Developed Regions • Latin America • East Asia • Middle East • South East Asia • South Asia • Sub-Saharan Africa
Anglo-America • HDI: .94 • Cultural Patters • Homogenous • 90% speak English and adhere to Christianity • No large minorities to be discriminated from economy • Exceptions • French speaking Québécois • Some intolerance against ethnic minorities
Anglo-America Cont’ • Access to Resources • Major producer of steel, automobiles, etc. • Leading consumers of world market
Adaptation to Global Economy • Loss of Manufacturing • Leading provider of: financial services, high-tech jobs, entertainment, and recreational services (media, sports, etc) • Most important food exporter
Western Europe • HDI: .93 • Cultural Patters • Strong Nation-States (historical conflict WWI and II) • Currently more unified politically, militarily, economically, and culturally • What are the two main treaty organizations in Europe?
Western Europe Cont’ • NIR: at or below 0 • Population Growth from Muslim and Hindi migration resulting in cultural diversity • HDI lower than Anglo America bc of periphery • Spain, Portugal, Southern Italy, and Greece • Other nations at or above Anglo American level
Adaptation to Global Economy • Must import much of its raw materials • Compensates by producing luxury items: insurance, banking, BMW , Mercedes • Sacrifice economic growth for social services
Eastern Europe • HDI: .80 • Only region where HDI has declined near LDC levels now • Legacy of the “Iron Curtain” of Communism • Didn’t invest in long-term economic improvements (modernizing) • Inefficient agriculture (import food) • Pollution • Centered on basic industry not consumer goods