Download
1 / 10
100 likes | 110 Views
This study investigates the role of ETBF in tumorigenesis in the distal colons of Min mice. Gene expression analysis in tumor-infiltrating myeloid cells and confirmation of Nos2 gene expression are also explored.

E N D
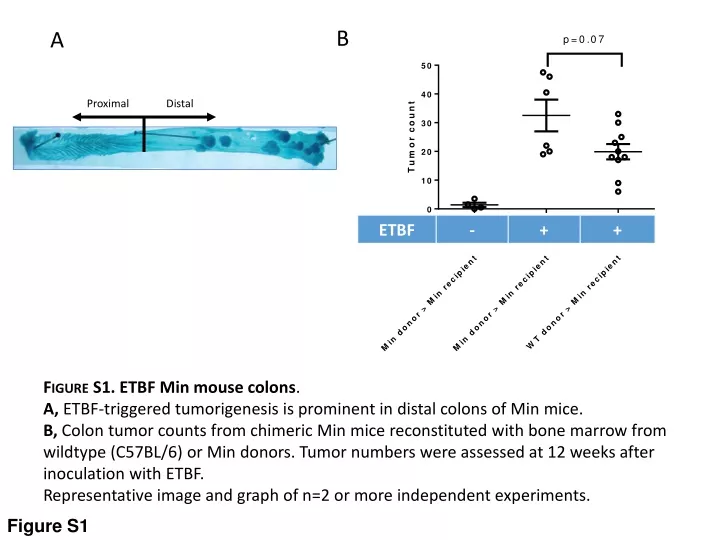
B A Proximal Distal Figure S1. ETBF Min mouse colons. A, ETBF-triggered tumorigenesis is prominent in distal colons of Min mice. B,Colon tumor counts from chimeric Min mice reconstituted with bone marrow from wildtype (C57BL/6) or Min donors. Tumor numbers were assessed at 12 weeks after inoculation with ETBF. Representative image and graph of n=2 or more independent experiments. Figure S1
RQ>2 RQ (MΦ / MO-IMC) ETBF-Min RQ<0.5 Figure S2. Gene expression analysis in ETBF tumor-infiltrating myeloid cells. MΦ and MO-IMCs were cell-sorted from 3 month ETBF Min colon tumors as CD11bhiGR1-MHC+F4/80+ and CD11bhiGR1loMHCloF4/80-, respectively. Bars represent fold increase of gene expression (RQ) in MΦ compared to MO-MDSCs. RQ>1, genes are overexpressed in tumor-associated macrophages; RQ<1, genes are overexpressed in MO-IMCs. Genes characterized by RQ>2 and RQ<0.5 are highlighted above and below the graph. Red boxes indicate genes characteristic of differentiated MΦ; green boxes indicate genes characteristic of MO-MDSCs. Representative graph of n=2 independent experiments. Figure S2
A RQ>2 RQ (PMN-IMC tumor / PMN-IMC spleen) ETBF-Min Tumor Spleen Figure S3A.Gene expression array in PMN-IMCs sorted from colon tumors or spleen of 3 month ETBF Min mice. Bars represent fold increase of gene expression (RQ) in IMCs sorted from tumors compared to those sorted from spleen. RQ>1 when genes are overexpressed in tumor IMCs; RQ<1 when genes are overexpressed in spleen. Genes characterized by RQ>2 are highlighted. Representative graph of n=2 independent experiments. Figure S3
B RQ (MO-MDSC tumor / PMN-IMC tumor) ETBF-Min MO-IMC PMN-IMC Figure S3B Same as in A, however comparing intratumoral MO-MDSCs to PMN-IMCs of 3 month ETBF Min mice. Representative graph of n=2 independent experiments. Figure S3
Min tumor Min blood Min spleen GR1hi CD11b+ GR1- CD11b- CD4 CD3 Figure S4. Myeloid cell populations (CD11b+GR1hi and CD11b+GR1neg) cell-sorted from colon tumors for IL-17 qPCR were not contaminated by T cells. Plots represent pre-sort CD3 and CD4 staining in CD11b+GR1hi, CD11b+GR1neg and CD11b- gates used for cell sorting and subsequent Il17a mRNA detection in myeloid cells associated with colon tumors, blood or spleen of 3 month ETBF-colonized Min mice. Representative staining of n=2 independent samples from one cell sorting experiment. Figure S4
A B p<0.1 PMN-IMC MO-MDSC (tumor) MO-IMC (spleen, blood) Il17a (1000x2-ΔCt) RQ (Min/WT) Tumor Spleen Blood Figure S5. Tumor-infiltrating MDSCs express Il17a gene in colon tumors. A, PMN-IMCs and MO-MDSCs or MO-IMCs were sorted from tumors, spleen or blood of 3 month ETBF-colonized Min mice. RNA extracted from each cell subset was assessed by qPCR for Il17a gene expression. Mean ± SEM is shown. Ct values were normalized with CtGapdh (ΔCt=Ct-CtGapdh) and bars represent 2-ΔCt. Aggregate data of n=2 independent experiments. B, Myeloid and lymphoid populations were cell-sorted from C57BL/6 (WT) or Min distal colon lamina propria at day 7 post-ETBF colonization and assessed for Il17a,Rorc, Irf4 and Il23r expression by qPCR. Bars represent fold increased (RQ) between Min and wild type cell populations, RQ=2-ΔΔCt. Representative staining of n=2 independent samples from one cell sorting experiment. Figure S5
Figure S6. Confirmation of Nos2 gene expression by detection of nitric oxide in culture supernatant of rIL-17-conditioned purified MO-MDSC. MO-MDSCs cell-sorted from colon tumors or MO-IMCs sorted from spleen in ETBF Min mice were incubated overnight with IL-17 (10 ng/ml) in presence or absence of LPS (100ng/ml). Nitric oxide (NO) was measured in culture supernatants using a colorimetric assay. Lines represent geometric mean. Aggregate data from n=3-4 independent experiments. Figure S6
Figure S7. Stool culture of oncogenic bacteria to confirm colonization. Fresh stool samples were collected 7 days after inoculation with F. nucleatum, pks+E. coli, E. coliΔPKS, ETBF or NTBF. Samples were homogenized in PBS, serially diluted and cultured on Brucella (F. nucleatum), BHI (ETBF, NTBF) or MacConkey (E. coli) agar under optimal anaerobic or aerobic conditions. Colony forming units were manually counted within 24-48h of culturing. Figure S7
Sham, sporadic colon tumor Sham, normal colon tissue GR1lo GR1hi GR1lo GR1hi MΦ11% MΦ22% MO-IMC 53% PMN-IMC 96% MO-IMC 69% PMN-IMC 81% ETBF, colon tumor ETBF, normal colon tissue GR1lo GR1hi GR1lo GR1hi MΦ7% MΦ47% F4/80 MHCII F4/80 MHCII F4/80 F4/80 MHCII F4/80 MHCII F4/80 MHCII MHCII F4/80 MHCII F4/80 MHCII MO-IMC 22% PMN-IMC 85% MO-IMC 80% PMN-IMC 81% Figure S8. Additional representative flow plots of MO-IMC, PMN-IMC and Mϕ subsets in sporadically occurring or ETBF-triggered colon tumors, as well as normal colon tissue. As described in Fig. 3A, 3B. Figure S8
A B Figure S9. Gating strategy for the recovery of adoptively-transferred in vitro derived BM-MDSC. A, CD45.1+ bone marrow cells were harvested and MDSCs were derived in vitro by culture with G-CSF, GM-CSF and IL-13 for 5 days. MO-MDSCs were cell-sorted and adoptively transferred to Min recipients previously infected with ETBF (ETBF 11 weeks) via tail-vein injection. B, Colon tumors were harvested 1 week later (ETBF 12 weeks) and CD45.1+ were recovered and sorted by FACS for RNA extraction and Arg1/Nos2 qPCR analysis. Figure S9