Download
1 / 17
170 likes | 212 Views
Investigating the impact of extreme rainfall events on Cape Town and the Western Cape, exploring causes and simulation methods.

E N D
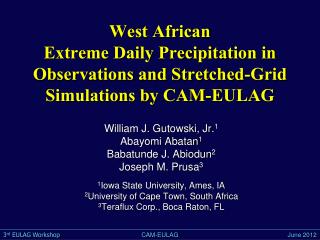
Simulating the Characteristics of Extreme Rainfall Events in Southern Africa using Regional Climate Models Babatunde J. Abiodun Sabina Abbar Omar and ArlindoMeque Climate System Analysis Group (CSAG)Department Environmental and Geographical ScienceUniversity of Cape Town (South Africa) Presented by: Kamoru A. Lawal
Study Domain: Southern Africa Mozambique Cape Town Western Cape
Impacts of Extreme Rainfall Events in the Western Cape • Displacement of communities • Damages to infrastructure • Loss of lives Damaging extreme rainfall event remains a big threat in the Western Cape.
Kalahari trough • Mid-latitude cyclone • Cut-off low • Tropical Temperate Trough • Agulhas Current Causes of Extreme Rainfall in the Western Cape
Aim and Objectives • Examine the capability of regional climate models (RCMs) in simulating the characteristics of widespread extreme rainfall events (WERE) over the Western Cape • Examine how GCM boundary forcing may alter the characteristics of the simulated WERE.
Simulation and observation Datasets WRF REGCM3 ERA-Interim CORDEX RCMs REMO PRECIS ARPEGE RACMO CRCM5 CCLM TRMM SMHI-RCA GPCP ICHEC ERAINT SMHI-RCA MIROC CCMA NCC MPI CNRM
Methods • Extreme rainfall event: defined at each grid point as rainfall above the 95th percentile of daily rainfall at the grid point • Widespread extreme rainfall event (WERE): defined as a simultaneous occurrence of extreme rainfall events over at least 60% of the Western Cape area (i.e. about 60 grid points).
Simulated and observed threshold of extreme rainfall over Southern Africa (mm/day) • There are notable differences between GPCP and TRMM results • Only four RCMs (CRCM5, RCA3,WRF and REMO) perform better than ERAINT in simulating the observed threshold pattern
Seasonal distribution of widespread extreme rainfall over the Western Cape • GPCP and ERAINT report different total number of WERE. • Among the RCMs, PRECIS reports the highest number the WERE, while CCLM reports the lowest number.
3 1 2 4 The classification of the observed and simulated WERE, using the Self Organizing Map (SOM), shows four main groups of WERE over the Western Cape
The frequency of WERE in each SOM node as observed (GPCP and TRMM) and simulated (ERAINT and RCMs).
The sensitivity of RCA-simulated WERE over the Western Cape to GCM forcing All the WEREs are link to mid-latitude rainfall activities
Conclusion • Only four RCMs perform better than ERAINT in simulating the threshold of extreme rainfall over Southern Africa • All RCMs underestimate the extreme rainfall threshold over the Western Cape • The RCMs perform very well in simulating the seasonal variation of WERE over the Western Cape, but perform poorly in simulating the inter-annual variability. • When forced with ERINT, all RCMs reproduce the four main pattern of WERE in the Western Cape, but when forced GCM, RCA model reproduces only one pattern.
Thank you!!! babiodun@csag.uct.ac.za