Download
1 / 42
420 likes | 587 Views
Portable Fuel Analyzer System (PFAS)/ Multiple Fuel Optimization System(MFOS ). Advanced Multi-Fuel Systems PO Box 2191 Woodbridge, VA 22193 703-303-1752. The Goal.

E N D
Portable Fuel Analyzer System (PFAS)/Multiple Fuel Optimization System(MFOS) Advanced Multi-Fuel Systems PO Box 2191 Woodbridge, VA 22193 703-303-1752
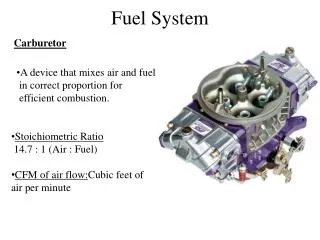
The Goal • Develop a compact, portable, remote fuel quality sensor capable of differentiating most types of fuels used in commercial, industrial, aviation and military applications. • Portable fuel Quality Analyzer (PFAS) • Combustion Optimization Network (MFOS)
Today’s Challenge • Engines designed for diesel/distillate fuel, but required to use the lighter kerosene fuels, or gasoline/spark assisted engines operating on alternative fuels • Cannot design engine to operate optimally on two or more different fuels • Resultant compromise yields a “multi-fuel capability” but • Lower fuel economy (mpg) • Slower acceleration/top speed • Reduced power at fuel rack settings • Compromised exhaust emissions
The Solution • Develop system capable of instaneously optimizing engine performance regardless of fuel being consumed • True multi-fuel capability achieved without compromising performance
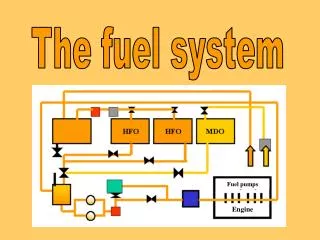
What is the MFOS? • MFOS is a two component unit consisting of a fuel-sensor coupled with a Neural Network main computer/engine control unit. • It uses state of the art, proven and patented technology to identify fuel patterns and electronically control internal and external combustion engines to achieve optimum performance for a wide variety of fuels.
Benefits of the MFOS System • This low cost system will complement existing engine components, allowing operation at optimum levels with the ability to use locally available or environmental friendly fuels. • It will allow virtually all engines to run on a wide variety of fuels without loss of power, fuel efficiency or engine life, with the added benefit of lowering fuel consumption and exhaust emissions.
Circuit Design Case Design Evaluation Evaluation Prototype Performance Quality Check NG 1. Variation 2. Repeatability 3. Temperature dependency 4. Supply Voltage Dependency OK Mass Production Flowchart for Design
Sensor System Development FEORC 9/99 FEORC 11/99
Results for the Portable FuelClassification Analyzer 6 March 2000 Fiber & Electro-Optics Research Center The Bradley Department of Electrical Engineering Virginia Polytechnic Institute and State University 106 Plantation Road 0356, Blacksburg VA 24061
Parameters Determined • Smaller organic solvent sensor evaluated and discarded • Successful signature difference achieved with one gas and one ammonia sensor • Heater control parameter switched from Vh to Ih • Sampling times vary from 30 to 60 seconds • Process automated • Signature differentiation program created
Parameters to be Determined • Blanket sensor exposure time • Effectively incorporating ammonia sensor data • Humidity and temperature influences • Repeatability, error, deviation, reliability of measurements and reversibility • Requirements on fluid/gas atomization and flow rate
Recommendations • Compare increasing warm-up time with the existing signatures • Extend pre-sample waiting period • Observe temperature fluctuations • Possibly change the software to always sample at certain thermistor voltage levels
Questions? Hans Mumm Advanced Multi-Fuel Systems PO Box 2191 Woodbridge, VA 22193 703-303-1752
Multiple Fuel Optimization System(MFOS) BACK UP SLIDES
Current Phase of Development • Three phases of the project • Analysis of the problem and wiring of the sensor • Automation of the data acquisition process • New circuit board • different load resistance • temperature • humidity
Parameters • Load resistance • 1.5, 5, 8 and 20 k • Ambient temperature • 21.5 to 23.2 °C • Ambient humidity • 20.3 to 22.1 % RH
Comparison of Derivatives of 93 Octane Gasoline Fuel Signatures 0.6 0.4 0.2 0 -0.2 -0.4 -0.6 -0.8 0 10 20 30 40 50 60 Derivatives of 93 OctaneGasoline Fuel Signatures
Comparison of Cumulative Integrals of Diesel Fuel Signatures 16 14 12 10 8 6 4 2 0 0 10 20 30 40 50 60 Cumulative Integrals ofDiesel Fuels
Comparison of Cumulative Integrals of Kerosene Fuel Signatures 10 8 6 4 2 0 -2 -4 0 10 20 30 40 50 60 Cumulative Integrals ofKerosene Fuels
Comparison of Cumulative Integrals of 93 Octane Gasoline Fuel Signatures 18 16 14 12 10 8 6 4 2 0 0 10 20 30 40 50 60 Cumulative Integrals of 93 Octane Gasoline Fuels
Comparison of Cumulative Integrals of 87 Octane Gasoline Fuel Signatures 18 16 14 12 10 8 6 4 2 0 0 10 20 30 40 50 60 Cumulative Integrals of 87 Octane Gasoline Fuels
Comparison of Cumulative Integrals of the Fuel Signatures 20 15 10 5 0 -5 0 10 20 30 40 50 60 Comparison of Cumulative Integrals of the Fuel Signatures
Conclusion • Smaller load resistance yields increased signature details • First derivative and cumulative integral offer valuable additional information toward signature differentiation • Initial temperature variations observed