Download
1 / 29
290 likes | 355 Views
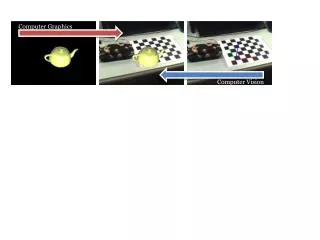
Learn how transformation works through eigendecomposition, understanding spectral analysis, PCA, and bounding box applications in computer graphics. Explore mapping data, eigenvectors, eigenvalues, and optimal approximations. Discover the significance and practical usage of orthogonal bases and scatter matrices.

E N D
Computer Graphics Recitation 6
Last week - eigendecomposition • We want to learn how the transformation A works: A
Last week - eigendecomposition • If we look at arbitrary vectors, it doesn’t tell us much. A
Spectra and diagonalization • Moreover, if A is symmetric, the eigenvectors are orthogonal (and there’s always an eigenbasis). A A = UUT = Aui = iui
In real life… • Matrices that have eigenbasis are rare – general transformations involve also rotations, not only scalings. • We want to understand how general transformations behave. • Need a generalization of eigendecomposition SVD: A = UVT • Before we learn SVD, we’ll see Principal Component Analysis – usage of spectral analysis to analyze the shape and dimensionality of scattered data.
The plan for today • First we’ll see some applications of PCA • Then look at the theory.
PCA – the general idea y’ x’ • PCA finds an orthogonal basis that best represents given data set. • The sum of distances2 from the x’ axis is minimized. y x
PCA – the general idea • PCA finds an orthogonal basis that best represents given data set. • PCA finds a best approximating plane (again, in terms of distances2) z 3D point set in standard basis y x
PCA – the general idea • PCA finds an orthogonal basis that best represents given data set. • PCA finds a best approximating plane (again, in terms of distances2) 3D point set in standard basis
Application: finding tight bounding box • An axis-aligned bounding box: agrees with the axes y maxY minX maxX x minY
Usage of bounding boxes (bounding volumes) • Serve as very simple “approximation” of the object • Fast collision detection, visibility queries • Whenever we need to know the dimensions (size) of the object • The models consist of thousands of polygons • To quickly test that they don’t intersect, the bounding boxes are tested • Sometimes a hierarchy of BB’s is used • The tighter the BB – the less “false alarms” we have
Application: finding tight bounding box • Oriented bounding box: we find better axes! x’ y’
Application: finding tight bounding box • This is not the optimal bounding box z y x
Application: finding tight bounding box • Oriented bounding box: we find better axes!
Notations • Denote our data points by x1, x2, …, xn Rd
The origin of the new axes • The origin is zero-order approximation of our data set (a point) • It will be the center of mass: • It can be shown that:
Scatter matrix • Denote yi = xi – m, i = 1, 2, …, n = d d
Scatter matrix - eigendecomposition • S is symmetric S has eigendecomposition: S = VVT S v1 1 2 v2 = v1 v2 vn n vn The eigenvectors form orthogonal basis
Principal components • S measures the “scatterness” of the data. • Eigenvectors that correspond to big eigenvalues are the directions in which the data has strong components. • If the eigenvalues are more or less the same – there is not preferable direction.
Principal components • There’s no preferable direction • S looks like this: • Any vector is an eigenvector • There is a clear preferable direction • S looks like this: • is close to zero, much smaller than .
How to use what we got • For finding oriented bounding box – we simply compute the bounding box with respect to the axes defined by the eigenvectors. The origin is at the mean point m. v3 v2 v1
For approximation y v2 v1 x y y x x The projected data set approximates the original data set This line segment approximates the original data set
For approximation • In general dimension d, the eigenvalues are sorted in descending order: 1 2 … d • The eigenvectors are sorted accordingly. • To get an approximation of dimension d’ < d, we take the d’ first eigenvectors and look at the subspace they span (d’ = 1 is a line, d’ = 2 is a plane…)
For approximation • To get an approximating set, we project the original data points onto the chosen subspace: xi = m + 1v1 + 2v2 +…+ d’vd’ +…+dvd Projection: xi’ = m + 1v1 + 2v2 +…+ d’vd’ +0vd’+1+…+ 0vd
Optimality of approximation • The approximation is optimal in least-squares sense. It gives the minimal of: • The projected points have maximal variance. Original set projection on arbitrary line projection on v1 axis
Technical remarks: • i 0, i = 1,…,d (such matrices are called positive semi-definite). So we can indeed sort by the magnitude of i • Theorem: i 0 <Sv, v> 0 v Proof: Therefore, i 0 <Sv, v> 0 v
Technical remarks: • In our case, indeed <Sv, v> 0 v • This is because S can be represented as S = XXT, X is dn matrix • So:
Technical remarks: • S = XXT, X is dn matrix = = d d = XXT =