Download
1 / 7
70 likes | 94 Views
Students will engage in hands-on data analysis activities, analyzing relationships through graphing and averages using real-life scenarios. Complete the to-do list and rotate through lab stations with timed activities.

E N D
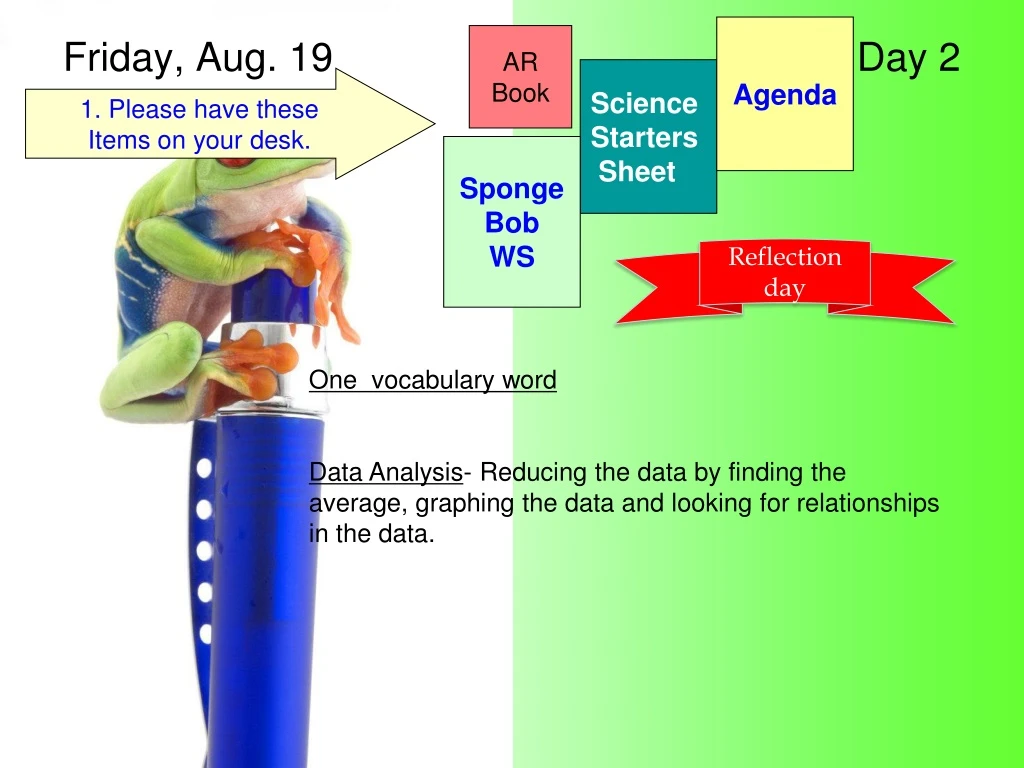
Agenda AR Book ScienceStarters Sheet 1. Please have these Items on your desk. Friday, Aug. 19 Day 2 Sponge Bob WS Reflection day One vocabulary word Data Analysis- Reducing the data by finding the average, graphing the data and looking for relationships in the data.
To do list . . . . . • Correct homework • Lab station work rotation • 3 minutes at each lab station • http://www.online-stopwatch.com/countdown-timer/ • https://www.youtube.com/watch?v=Hxbz656Euyw
Station 1 • How fast the grass grows depends on how much rain we get. • The number of problems missed on a test determines your grade on the test. • Station 2 • 3. How long I talk on my cell phone depends on the number of minutes on my • calling plan.
Station 3 • 5. The number of cakes sold in a bake sale determines the amount of money made • 6. The winner of the football game depends on which side scored the most points • Station 4 • 7. The amount of memory on a CD determines how many songs I can download to • it. • 8. My grade in math class is a function of the number of hours I spend studying.
Station 5 • 9. Does the weight of a car affect it’s gas mileage? • 10. The hungrier a cat gets, the louder he meows. • Station 6 • 11. As the room gets darker, the harder it is to see colors. • 12. Is the growth of a plant affected by acid rain?
Station 7 • 13. Does surface area of a sponge affect the speed of evaporation? • 14. Does one brand of nail polish dry faster than another? • Station 8 • 15. Is the number of puppies affected by the age of the mother? • 16. Is memory retention affected by the noise level of a room?