Download
1 / 1
10 likes | 61 Views
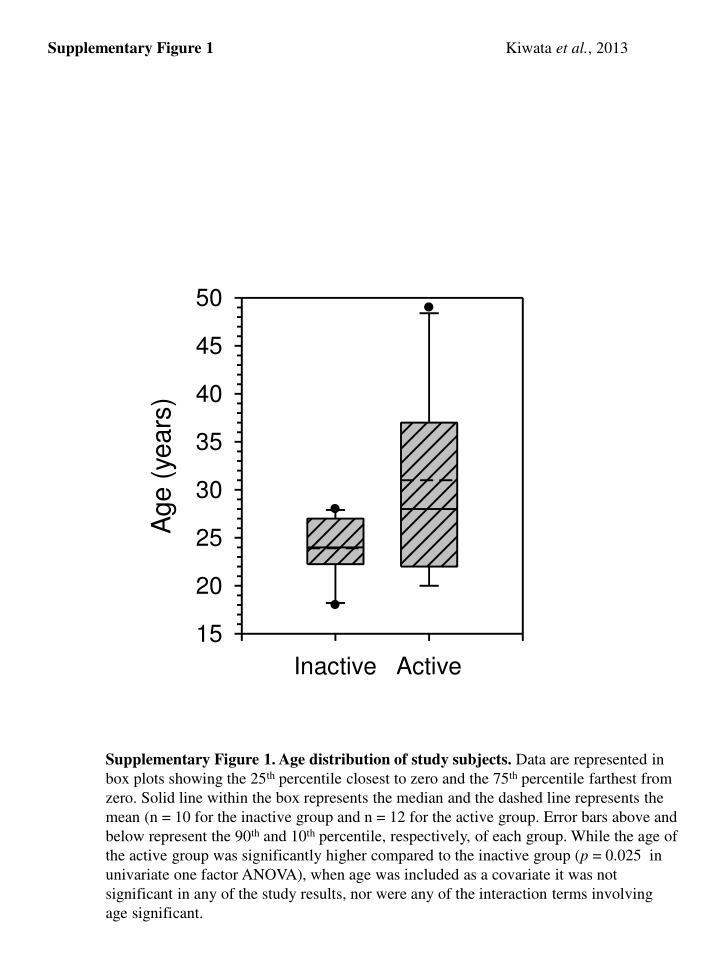
This study presents the age distribution of study subjects in active and inactive groups using box plots. While the active group showed significantly higher age compared to the inactive group in univariate analysis, age was not a significant factor when included as a covariate in the study results.

E N D
Supplementary Figure 1 Kiwata et al., 2013 Supplementary Figure 1. Age distribution of study subjects. Data are represented in box plots showing the 25th percentile closest to zero and the 75th percentile farthest from zero. Solid line within the box represents the median and the dashed line represents the mean (n = 10 for the inactive group and n = 12 for the active group. Error bars above and below represent the 90th and 10th percentile, respectively, of each group. While the age of the active group was significantly higher compared to the inactive group (p = 0.025 in univariate one factor ANOVA), when age was included as a covariate it was not significant in any of the study results, nor were any of the interaction terms involving age significant.


