Download
1 / 45
450 likes | 753 Views
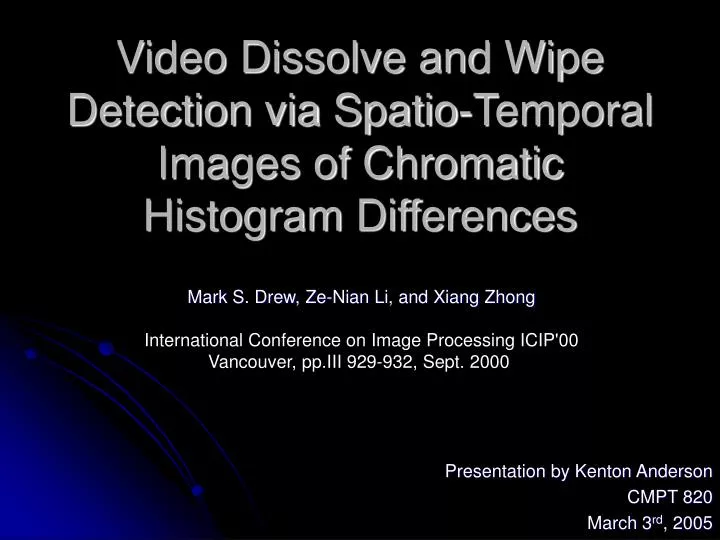
Video Dissolve and Wipe Detection via Spatio-Temporal Images of Chromatic Histogram Differences. Mark S. Drew, Ze-Nian Li, and Xiang Zhong International Conference on Image Processing ICIP'00 Vancouver, pp.III 929-932, Sept. 2000 . Presentation by Kenton Anderson CMPT 820 March 3 rd , 2005.

E N D
Video Dissolve and Wipe Detection via Spatio-Temporal Images of Chromatic Histogram Differences Mark S. Drew, Ze-Nian Li, and Xiang Zhong International Conference on Image Processing ICIP'00 Vancouver, pp.III 929-932, Sept. 2000 Presentation by Kenton Anderson CMPT 820 March 3rd, 2005
Overview • Background • Introduction • Wipe and Cut detection • Dissolve detection • Conclusions
Background • What is a shot? • Uninterrupted segment of video time • The boundary between two shots is a camera break • Three major types of transitions: • Cut (instant) • Wipe (gradual) • Dissolve (gradual)
Gradual Transitions • Wipe transition • Moving boundary line between two shots crossing the screen such that one shot replaces the other • Dissolve transition • One shot blends smoothly into a second shot
Introduction Content-Based Image/Video Search, Retrieval, and Segmentation • Why detect video transitions? • Segmentation is an important basic step! • Before scenes can be searched for content, the location of the scenes have to be determined
Introduction • This paper presents methods to detect gradual transitions using 2D chromaticity histogram metrics: • Histogram intersection for wipes • Color-distance Histogram metric for dissolves • Both generate potential indicators of shot transitions, with good results
Wipe and Cut Detection • In a wipe, a boundary line crosses the first shot, revealing the second shot
Wipe and Cut Detection • Ngo et al. “Detection of gradual transitions through temporal slice analysis” • Taking the pixels from the middle column and placing them sideways, stacking them over time Column C at time t1 Column C Y t t1 Y X
Wipe and Cut Detection • Detect lines in the resultant spatio-temporal image
Wipe and Cut Detection • Instead of using pixels, convert to 2D chromaticity coordinates • r = R R + G + B • g = G R + G + B • Recall chromaticity from our class notes
Wipe and Cut Detection • 2D chromaticity conversion effectively eliminates the shadows • Form a 2D chromaticity histogram for each column • Using the DC component of the frames • Using Histogram Intersection, compare a frame to its previous frame to detect differences.
Wipe and Cut Detection • From frame to frame, the histogram intersection value for a column stays nearly the same • When the Wipe Boundary hits that column, the histogram intersection value is near zero Cut t Wipe X Each element in a row represents a histogram intersection value for each column in the image (Black == 0)
Wipe and Cut Detection Conclusions • Note that this techniques takes into account the entire image frame • Not just a slice • The previous image has no edge enhancement performed on it • Raw data
Dissolve Detection • Replaces every pixel with a mixture of the two shots over time, gradually replacing the first by the second • Each pixel is affected gradually
Dissolve Detection • Frame by frame of a cross dissolve • Diagram
Dissolve Detection • For dissolve detection, 2D Cb-Cr chromaticity space is adopted • Recall from our class notes that YCbCr Colour model is used in JPEG image compression and MPEG video compression • YCbCr is closely related to YUV • Y’ is the luma (for gamma corrected signals) • U and V is the chrominance U = B’ – Y’ V = R’ – Y‘
Dissolve Detection • Define transition as; R = A + α(t)(B – A) (1) • Where A and B are 2-vectors for video A and video B, in Cb-Cr space • α(t) is a transition function α(t) = Kt, with Ktmax ≡ 1 (2)
Dissolve Detection • Histogram Intersection fails on simple cases for dissolve detection • For example, uniformly-coloured still images • H (K, M) never really drops to zero • To counter this problem, use a histogram-difference metric
Dissolve Detection • Histogram-difference metric: • Hafner et al.’s metric is a weighted distance between colour distributions of two images, generating a histogram distance measure • Histogram difference D2 D2 = zTAz
Dissolve Detection Summary of modifications • For the histogram difference D2 • Use 2D CbCr chromaticity space (vs 3D color) • Use only DC components of video • Analyzes actual pixel values (vs histogram) • Use Euclidean Distance metric for difference • Derivation
Dissolve Detection Results of modifications • For time t1 and t2(beginning and ending of dissolve transition) • Temporal differences for each column is • k(t1 - t2)2, k is a constant • If t1 – t2 is constant, D2 is constant • Normalized D2 is approximately • 0 outside a dissolve • 1 during a dissolve
Dissolve Detection Results of modifications cont’d • For time t1 and t2(beginning and ending of dissolve transition) • If t1 is fixed, and t2 varies, √D2 is linear • D2 has 3 components, each quadratic in time, thus having a linear derivative
Dissolve Detection • Fully derived expression • for linear transition D2 = 2(1/d2max) K2(t1-t2)2 ∑∑(Bi-Ai)T(Bj-Aj) i j
Dissolve Detection Process • 2 frames as part of a dissolve in Cb-Cr space t1: initial frame Result t2: time-varying frame √D2 D2 (t1 – t2) = ∆t is NOT constant
Dissolve Detection • Results: Approx. 1 Approx. 0 √D2, differencing frame to initial frame at a 1 frame interval
Dissolve Detection Process • 2 frames as part of a dissolve in Cb-Cr space t1: frame A Result t2: frame B ⌡D2 D2 (t1 – t2) = ∆t is constant Derivative D2 is linear
Dissolve Detection • Results: • D2, differencing for a constant t1-t2 • Boundaries of the transition are evident • Values in Transition periods are relatively constant Derivation of D2 Time t
Dissolve Dectection Conclusions • Use of multiple columns and rows provides a large number of descriptors for gradual transitions • For constant t1 – t2 • D2 is constant during transitions, 0 otherwise • For fixed t1 • D2 is 1 during transition, 0 otherwise • In testing, this measure performs best when each video in the dissolve does not change much during the transition
Conclusions • 2 new measures are presented for detecting cuts, wipes and dissolves • Both use multiple columns (or rows or diagonals) to generate descriptors • Histogram intersection is fast and effective • In Dissolve testing, the measures perform best when each video in the dissolve does not change much during the transition
Histogram Difference Derivation • Histogram difference D2 D2 = zTAz (3) • A = [aij] is a symmetric matrix where aij denotes similarity between bins i and j • Ared,orange,blue = R O B R O B Red and Orange are considered highly similar
Histogram Difference Derivation D2 = zTAz (3) • For aij, aij = (1 – dij/dmax) (4) • dij defined as a three-dimensional colour difference • Vector z is a histogram-difference vector (for vectorized histograms) • For example, z would be of length 256 if our chromaticity histograms were 16x16
Histogram Difference Derivation • Instead of 3D colour space, we use 2D CbCr chrominance space • Also, use an Euclidean distance metric • aij will no longer be linear under a temporal transition with linear α(t) • This modification maintains the linearity: aij = (1 – d2ij/d2max) (5)
Histogram Difference Derivation • Suppose we use only DC components • Each frame will consist of only 1/8th of the number of rows in an image • Recall equation (3) D2 = zTAz (3) • z is the difference of 2 histograms, x and y z = (x – y) • x and y are normalized to 0 ≤ xi, yi ≤ 1, ∑x = ∑y = 1 • Then -1≤ zi ≤ 1
Histogram Difference Derivation • To generate an analytic expression: • Assume x and y are infinitely precise, z = (1, 1, 1, …, -1, -1, -1) • In our video transition context, • This means 1’s entries for current column for the previous frame, and -1’s entries for the current column in the current frame
Histogram Difference Derivation • Expanding D2 = zTAz, given assumptions: • Where R is the CbCr 2-vector at time t1 for the i-th row in the current column • Differencing between time t1 and time t2
Histogram Difference Derivation • With a Euclidean distance metric and substituting equation (1): R = A + α(t)(B – A)
Histogram Difference Derivation • For linear transition (as is usually the case for dissolves), the previous equation can be simplified: • Since the sum above is simply a constant, then for constant (t1 – t2), the difference D2 is constant over the transition! Back
Histogram Intersection • Given a pair of histograms, K and M, each containing n buckets, the intersection is: n H =∑min(Kj, Mj) j=1 • The result of the intersection is the number of pixels in M that have corresponding pixels of the same colour in K
Histogram Intersection Example 1 Two sample histograms for 4-bit greyscale 4x4 images K1 M H (K, M) = 6 + 0 + 8 + 2 = 16
Histogram Intersection Example 2 Two sample histograms for 4-bit greyscale 4x4 images K2 M H (K, M) = 1 + 0 + 1 + 2 = 4
Histogram Intersection • Normalized between 0 and 1: H(K, M) = • Closer to zero, less histogram match ∑min(Kj, Mj) ∑Mj
Histogram Intersection • High-level representation Poor match K M Close match K M Back
Euclidean Distance • If u = (x1, y1) and v = (x2, y2) are two points on the plane, their Euclidean distance is given by: √(x1 – x2)2 + (y1 – y2)2 • Geometrically, it's the length of the segment joining u and v • For dij, which was previously defined as our 3D colour difference Back