Download
1 / 43
430 likes | 591 Views
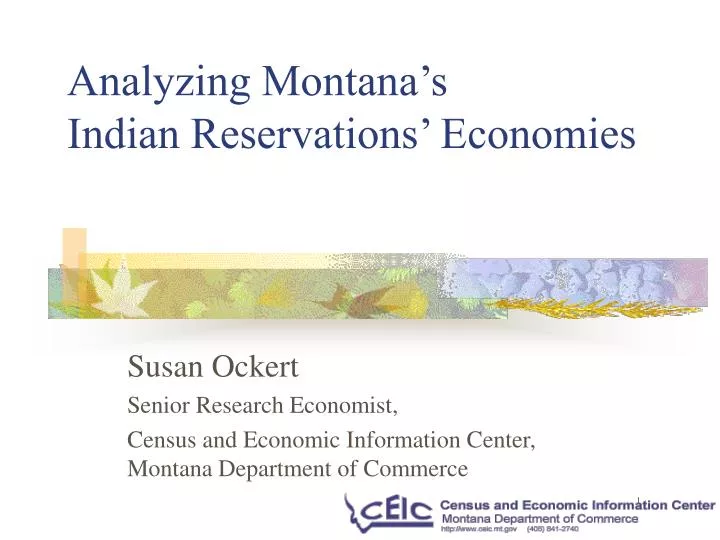
Analyzing Montana’s Indian Reservations’ Economies. Susan Ockert Senior Research Economist, Census and Economic Information Center, Montana Department of Commerce. Outline. Census Data What is an Economy? Measuring Reservation Economies Determining Potential Sources for Statistics.

E N D
Analyzing Montana’s Indian Reservations’ Economies Susan Ockert Senior Research Economist, Census and Economic Information Center, Montana Department of Commerce
Outline • Census Data • What is an Economy? • Measuring Reservation Economies • Determining Potential • Sources for Statistics
Population Numbers • U.S. Census Bureau • Every 10 years on April 1 • Self-reported • Residence within Census boundaries • Housing and Urban Development (HUD) • Three year average • Service population • Institutional population may not be in area • Tribal • Tribal members • Annual
Why Census? Federal programs rely on census data for funding • Indian Child Welfare Act • Child and Family Services Programs • Families by race and age distribution • Title 6 – Grants to Indian Tribes • Programs for Aging • Age distribution by race • Indian Community Development Block Grants • Housing and economic opportunities for low and moderate income • Income/poverty data • Indian Employment Assistance • Vocational training and employment opportunities • Employment/Occupation by race
Census 2010 Pilot project in South Dakota • Work directly with tribes • Door-to-door visits by trained resident enumerators rather than mailed forms • Publicity campaigns: census data confidential so can not be used against individual • Use of hand-held electronic devices to identify exact location of house • Visit all rural areas on reservation
Daniels Glacier Sheridan Hill Blaine Flathead Phillips Roosevelt Pondera Valley Sanders Lake Chouteau Missoula Rosebud Yellowstone Big Horn SOURCE: U.S. CENSUS BUREAU, CENSUS 2000
Population by American Indian and by Tribe: Source: U.S. Census Bureau, Census 2000
American Indian Population: Urban vs Rural Urban = 1,000 people per square mile *Metropolitan Areas: Billings, Great Falls, Missoula **Concentrations of population, housing, and commercial structures that are identifiable by name but have no legal authority. Source: U.S. Census Bureau, Census 2000
What is an ‘economy’? Jobs Income Businesses • Public Finance • Zoning/Land Use • Public Works • Public Safety Consumers Government Create Wealth • Marketing • Customer Service • Accounting • Management 67% of GDP Source: “Understanding Your Community’s Economic Base,” University of Missouri Extension, http://muextension.missouri.edu Redistribute Wealth
Population Faster growth rate Younger median age Education Fewer with degrees Higher drop out rate Social Larger percent of population uses food stamps Higher pregnancy rate Higher alcohol treatment need Current Reservation Environment
Current Reservation Economies • Higher unemployment • More poverty • Lower per capita income • Lower wages • Lower housing values • Smaller private sector
Types of Jobs • 33% of jobs on the reservation are Government compared with 15% of jobs in the country as a whole • 44% of jobs on the reservation are in the Private Sector compared with 80% of jobs in the nation Source: Federal Reserve Bank of Minneapolis, fedgazette, March 2006
Business Environment NOTE: AI = American Indian Source: U.S. Census Bureau, “Survey of Business Owners”
INDUSTRY COMPARISONS * Indian Owned Businesses Only ** MT Average Weekly Wages Sources: See last page
NON-RESERVATION INDUSTRIES * Indian Owned Businesses Only ** MT Average Weekly Wages Source: See last page
Non-Reservation Business Locations Kalispell: 5 Havre: 5 Missoula: 5 Great Falls: 9 Helena: 10 Billings: 30 *Note: Indian Owned Businesses Only Source: See last page
Statistics represent labor characteristics of the reservation, not the tribe. Unemployment rates produced by MT Department of Labor Labor Force definition: Civilian, non-institutional population 16 years and older The sum of Employment and Unemployment Employment definition: Did any work as paid employees or, Worked in their own business, profession, or farm or, Worked 15 hours or more as unpaid workers in a family owned enterprise Unemployment Rate definition: Equal to the number of Unemployed divided by number in the Labor Force Statistics represent labor characteristics of the tribe, not the reservation. Labor Force definition: Number of tribal members between 16 and 64 years old Available for work Not disabled or incarcerated Employment definition: Tribal members working for money Unemployment definition: Calculated by subtracting Employment from Labor Force MT Dept of Labor, Research and Analysis Bureaus Criteria: UNEMPLOYMENT Bureau of Indian Affairs Criteria: www.ourfactsyourfuture.org
Productivity – Measure of Efficiency Average Output per Worker (IMPLAN) Minnesota IMPLAN Group, www.implan.com
Compensation per Worker Average Salary per Worker (IMPLAN) Minnesota IMPLAN Group, www.implan.com
Natural Resources • Montana Reservations compared to U.S. Reservations • 13% of all acres of coal • 12% of all oil and gas leases • 5% of all coal royalties/revenues • 5% of oil royalties/revenues Source: Minerals Management Office, U.S. Geological Survey
Agriculture on the Reservation * Due to confidential information, only 6 reservations used United States Department of Agriculture, National Agricultural Statistics Service, http://www.nass.usda.gov/Census_of_Agriculture/index.asp
Retail sales: Gauge of purchasing power Business – Where to Locate Population: 5,584 On reservation Population: 3,946 Off reservation How much population is needed? 16 mile radius – One establishment “Potential for Retail Trades in Rural Communities,” University of Missouri Extension, http://muextension.missouri.edu; Montana Natural Resource Information System, Interactive Mapping and Database Applications, http://nris.state.mt.us/interactive.html
Examples Population: 5,584 On reservation Population: 3,946 Off reservation Number of Establishments * Dollar stores, general stores, trading posts: retail new goods such as apparel, dry goods, house wares, etc. U.S. Census Bureau, Zip Code Business Patterns, 2003, www.census.gov
PRIVATE BUSINESSES Source for businesses: Reference USA and individual visits. Source for wages: Quarterly Census of Employment and Wages, (QCEW), Montana Department of Labor
GOVERNMENT Source for businesses: Reference USA and individual visits. Source for wages: Quarterly Census of Employment and Wages, (QCEW), Montana Department of Labor
Threshold Analysis • Central Place Theory - Population needed to support retail and service businesses • Simple Analysis: population and number of businesses • Similar characteristics such as population & location • Does not take into account economies of scale • Square footage • Number of doctors in one facility • Grocery store • Health care • Financial Institutions
Grocery Stores # Number of Businesses *Number of Businesses using statewide threshold of 2,725 On the Reservation: Browning, Wolf Point, Ronan Just Off the Reservation: Cut Bank, Hardin, Glasgow Trade Center: Havre, Miles City, Glendive Metropolitan: Missoula, Great Falls, Billings and Helena
On the Reservation: Browning, Wolf Point, Ronan Just Off the Reservation: Cut Bank, Hardin, Glasgow Trade Center: Havre, Miles City, Glendive Metropolitan: Missoula, Great Falls, Billings and Helena Health Care: Doctors and Clinics # Number of Businesses *Number of Businesses using statewide threshold of 509
On the Reservation: Browning, Wolf Point, Ronan Just Off the Reservation: Cut Bank, Hardin, Glasgow Trade Center: Havre, Miles City, Glendive Metropolitan: Missoula, Great Falls, Billings and Helena Financial Institutions # Number of Businesses *Number of Businesses using statewide threshold of 1,227
Implications • Reservations are underserved in these private sectors • Just Off the Reservation serving own population and reservation • Trade Centers and Metropolitans serve a much larger region
Location Quotient • Determine if number of jobs are what a local economy should have to serve local needs • Comparison of local employment to statewide for each industry • < 1 = underserved, > 1 = serving more than local • MT Department of Labor and Industry, Research and Analysis has calculated LQ for each county in Montana (www.ourfactsyourfuture.mt.gov)
Blackfeet Reservation Can not provide Location Quotient for most businesses since there are so few of them
Implications • Money is leaving the reservations to purchase retail goods and consumer services • There is not an adequate supply of financial services on the reservations • There is not an adequate supply of doctors, clinics, etc. on the reservations
Diversity of Economy • Hachman Index measures diversity of economy – employment spread out among many different industries compared to benchmark • Montana or United States • More diversity reduces community’s vulnerability to economic downturns • Closer to 1 mean more diversity • MT Department of Labor and Industry, Research and Analysis has calculated HI for each county in Montana (www.ourfactsyourfuture.mt.gov)
Hachman Index • Fort Peck Reservation = .24 • Blackfeet Reservation = .14 County Hachman Indices • Lowest (Stillwater) = .01 • Median = .25 • (McCone, Phillips, Toole) • Highest = .66 • (Gallatin, Missoula, Cascade)
Implications • Reservation and county economies are not diverse • ‘One company’ towns
Summary • Private businesses create wealth • Private goods and services • Business decisions • Governments redistribute wealth • Public goods and services • Government decisions
Legislative Representation Note: AIAN is American Indian Alaska Native
Contact Information Susan Ockert Montana Department of Commerce Census and Economic Information Center Senior Research Economist (406) 821-2740 sockert@mt.gov www.ceic.mt.gov
Sources: • Reservation Data: U.S. Census Bureau, Census 2000; US Department of Interior, Bureau of Indian Affairs, 2003; MT Department of Labor and Industry, Research Analysis Bureau, 2005 • Population: U.S. Census Bureau, Population Estimates Program, July 1, 2004 Estimates • Unemployment: MT Department of Labor and Industry, Research and Analysis Bureau, Labor Day Report 2005 • Per Capita: US Department of Commerce, Bureau of Economic Analysis, 2003 • Poverty: U.S. Census Bureau, Small Area Income & Poverty Estimates, 2002 • Housing Value: U.S. Census Bureau, Census 2000 • Median Age: U.S. Census Bureau, Census 2000 • % Food Stamps: MT Department Public Health and Human Services, Statistical Report June 2005 • Pregnancies: MT Department of Public Health and Human Services, Trends in Montana Teen Pregnancies and Their Outcomes 1981-2000, November 2002 • Alcohol treatment Need: MT Department of Public Health and Human Services, An Integrated Substance Abuse Treatment Needs Assessment for Montana, 2001 • Drop Out: Office of Public Instruction, Montana High School Dropout Rates by Race/Ethnicity, 2003-04 School Year • U.S. Census Bureau, Census 2000 American Indian and Alaska Native Summary File (AIANSF) – Sample Data, www.ceic.mt.gov/C2000/allreservationsbytribe.xls • U.S. Census Bureau, Census 2000 Summary File 2, Matrix PCT1. www.ceic.mt.gov/C2000/urban_rural_indian.xls • Industry Data:U.S. Census Bureau, “County Business Patterns” • Reference USA, • Small Business Administration, Minority Business Database, • Montana Department of Transportation, Disadvantaged Business Enterprise Program • Personal visits and interviews • Montana Business Alliance members • University of Montana American Indian Leadership