Download
1 / 8
80 likes | 344 Views
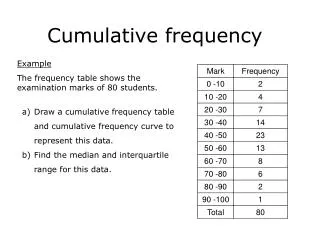
Cumulative Frequency Tables and Histograms. Unit 2, Day 4. A cumulative frequency column in a frequency table allows you to keep a running total of the frequencies in each category.

E N D
Cumulative Frequency Tables and Histograms Unit 2, Day 4
A cumulative frequency column in a frequency table allows you to keep a running total of the frequencies in each category.
The list shows the average high temperatures for 20 cities on one February day. Make a cumulative frequency table of the data. 69, 66, 65, 51, 50, 50, 44, 41, 38, 32, 32, 28, 20, 18, 12, 8, 8, 4, 2, 2
The data shows the ages of some hospital nurses. 33, 35, 23, 39, 23, 24, 34, 21, 57, 45, 57, 60, 45, 24, 31, 42, 61, 45, 35, 38 Make a cumulative frequency table of the data.
The table below lists the heights of students, in inches, in Mr. Munson’s 2nd period class. • Fill in the cumulative frequency table above.