Download
1 / 13
170 likes | 324 Views
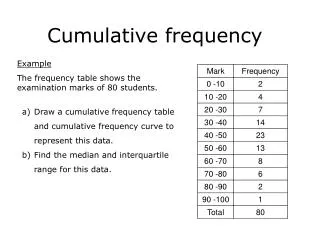
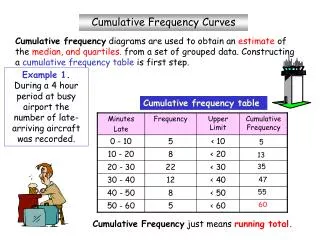
Cumulative frequency. Introduction. Cumulative frequency tables. A frequency table records the number of results that lie within a particular interval. Brett records the distance that his fellow grade 10 students live from school in this table. The data is split into class intervals.

E N D
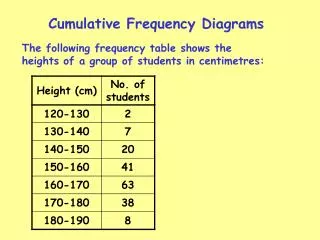
Cumulative frequency tables A frequency table records the number of results that lie within a particular interval. Brett records the distance that his fellow grade 10 students live from school in this table. The data is split into class intervals. Brett wants to know how many students live under 2km away, under 4km away, under 6km away, etc. What new columns should he add to his table to show this? A cumulative frequency table is used to record the number of results that occur up to a certain value.
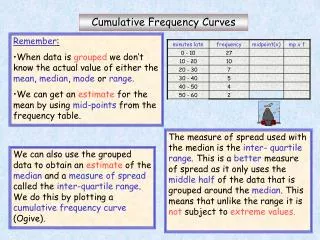
Choosing class intervals How long can everyone in the class keep their eyes open before blinking? How would you record this information? • Will you measure the times to the nearest tenth of a second, second or 5 seconds? • What size of class intervals will you use? When grouping continuous data like this, • aim to have between 5 and 10 intervals • make sure no values are missed out • make sure there are no overlaps.
Cumulative frequency graphs Here are the results of 100 people holding their breath: 9 9 + 12 =21 9 + 12 + 24 =45 9 + 12 + 24 + 28 =73 9 + 12 + 24 + 28 + 16 =89 9 + 12 + 24 + 28 + 16 + 11 =100 How could you find exact values or estimates for: • the mean? • the mode? • the median? • the range? To estimate the median, we can use a cumulative frequency graph.
Plotting cumulative frequency graphs Time holding breath 100 90 80 70 60 cumulative frequency 50 The cumulative frequency for each interval is plotted at the upper boundary for the interval. 40 30 20 The first point plotted is the lower boundary of the first class interval, which has cumulative frequency 0. 10 0 30 35 40 45 50 55 60 time in seconds
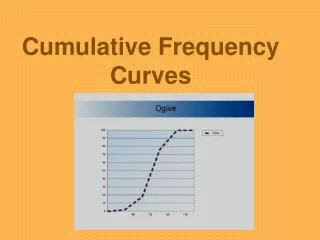
Plotting cumulative frequency graphs Time holding breath 100 90 80 70 60 cumulative frequency 50 The points can be joined by a smooth curve or by a series of straight lines. 40 30 20 This S-shape curve is characteristic of a cumulative frequency graph. 10 0 30 35 40 45 50 55 60 time in seconds
Finding the median Time holding breath How can we use the graph to estimate the median? 100 90 80 We can estimate the number of seconds the middle person held their breath forby finding the time for the 50th person. 70 60 cumulative frequency 50 From 50 on the y-axis, trace a line to the curve and find the corresponding x-value. 40 30 20 This gives us an estimated median time of 46 seconds. 10 0 30 35 40 45 50 55 60 time in seconds
Finding the interquartile range Time holding breath Use the cumulative frequency graph to locate the upper and lower quartiles, and then find the interquartile range. 100 90 80 70 The lower quartile is the time of the 25th person: 60 41 seconds cumulative frequency 50 The upper quartile is the time of the 75th person: 40 50.5 seconds 30 The interquartile range is the difference between these values. 20 10 50.5 – 41 = 9.5 seconds 0 30 35 40 45 50 55 60 time in seconds
Rainfall Rainfall for the first 100 days of the year 100 90 80 70 60 50 cumulative frequency (days) 40 30 20 10 0 3.5 4 4.5 5 5.5 6 6.5 0 0.5 1 1.5 2 2.5 3 7 rainfall (cm) What conclusions can be drawn from this graph?