Download
1 / 21
810 likes | 2.58k Views
الباب الرابع خرائط التحكم للخواص Control Charts for Attributes. د. محمد عيشـــوني m_aichouni@yahoo.co.uk http://aichouni.tripod.com. أستاذ مساعد – قسم التقنية الميكانيكية - 2004.

E N D
الباب الرابعخرائط التحكم للخواصControl Charts for Attributes د. محمد عيشـــوني m_aichouni@yahoo.co.uk http://aichouni.tripod.com أستاذ مساعد – قسم التقنية الميكانيكية - 2004
خرائط التحكم للخواص هي أداة تقنية للضبط الاحصائي لجودة المنتجات، تقوم على قياسات عامة لمدى مطابقة الوحدات المنتجة مع المواصفات القياسية من عدمه. • نقوم بتسجيل بيانات الجودة على شكل اعداد للقطع المطابقة conforming أو غير المطابقة (منتج معيب) non conforming. • هذه الخرائط على نوعين: • خريطة نسبة المعيب p chart • خريطة عدد العيوب c chart مقدمة عن خرائط التحكم للخواص
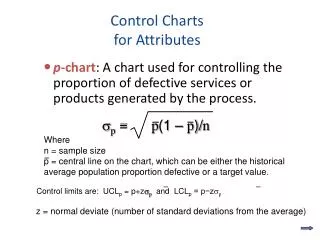
خريطة نسبة المعيب p chart • تقوم هذه الخرائط على دراسة قياس الصفات و خصائص المنتج و ذلك بتحديد النسبة المئوية الغير مطابقة للمواصفات (أو المعيبة). • مثال : عدد الكراسي التالفة في القاعة = 5 العدد الإجمالي للكراسي المفحوصة (الموجودة في القاعة) = 50 نسبة الكراسي المعيبة = 5/ 50 * 100 = 10% • القطعة المفحوصة : مطابقة أو غير مطابقة
عدد الوحدات المعيبة في كل عينة العدد الاجمالي للوحدات في كل عينة p = خريطة نسبة المعيب p chart • تؤخذ عينات من خط الانتاج على فترات مختلفة و تفتش على جودة المنتج بحساب عدد الوحدات المعيبة(#nonconforming items)و من ثم و قصد انشاء خريطة نسبة المعيب نقوم بما يلي: • حساب نسبة المعيب في كل عينة • حساب حدود الضبط للنسبة • رسم خريطة نسبة المعيب مع حدود الضبط • دراسة اسباب أي انحرافات قد نلاحظها.
p Chart Control Limitsحساب حدود الضبط الحد الأعلى للضبط Upper Control Limit الحد الأدنى للضبط Lower Control Limit الانحراف المعياري لنسبة المعيبp متوسط نسبة المعيب في العيناتp • يمثل z معامل ضرب نستعمله كالتالي: • z = 2 for 95.5% limits; • z = 3 for 99.7% limits
مثال عملي لخريطة نسبة المعيب p chart • شركة صناعية تصنع قطع ميكانيكية لمحركات الديزل. أخذت 10 عينات من خط الانتاج, تحتوي كل واحدة على 100 قطعة و تم التفتيش عنها حسب مواصفات معينة و رصدت أعداد القطع المعيبة على الجدول التالي: • هل نظام التصنيع منضبط احصائيا أم لا؟
مثال عملي 2p chart عدد العيناتm = 10 عدد القطع في كل عينة n = 100 متوسط نسبة المعيب في كل العينات
مثال عملي 3p chart حساب حدود الضبط z = 3
P C h a r t 0 . 1 0 3 . 0 S L = 0 . 0 9 5 3 6 النسبة n o i t r o 0 . 0 5 p o r P = 0 . 0 3 8 0 0 P 0 . 0 0 - 3 . 0 S L = 0 . 0 0 0 رقم العينة 0 1 2 3 4 5 6 7 8 9 1 0 S a m p l e N u m b e r p chartرسم خريطة نسبة المعيب 4
مثال عملي لخريطة عدد العيوب c chart • شركة وودلاند تصنع ورق لطباعة الجرائد. في آخر مرحلة الانتاج قام مفتش الجودة لدى الشركة بالتفتيش عن جودة الورق بإجراء قياسات لخصائص الجودة على 5 لفات من الورق المصنع و رصد النتائج المجدولة أدناه. • المطلوب : عن طريق خريطة التحكم لعدد العيوب ادرس استقرار العملية التصنيعية للشركة (هل نظام التصنيع منضبط احصائيا أم لا ؟)(احسب ب: z = 2)
تدريب 1 – حالة دراسية عن بنك Construction of p chart Example 1 Sample Wrong Number Account Number 1 15 2 12 3 19 4 2 5 19 6 4 7 24 8 7 9 10 10 17 11 15 12 3 The operations manager of the booking services department of Hometown Bank is concerned about the number of wrong customer account numbers recorded by Hometown personnel. Each week a random sample of 2,500 deposits is taken, and the number of incorrect account numbers is recorded. The records for the past 12 weeks are shown in the following table. Is the process out of control? (Use 3-sigma control limits.)
Plate No. of No. Nonconformities 1 1 2 0 3 4 4 3 5 1 6 2 7 5 8 0 9 2 10 1 11 1 12 0 13 8 14 0 15 2 16 1 17 3 18 5 19 4 20 6 21 3 22 1 23 0 24 2 25 4 تدريب 2 Construction of c chart Example 2 Surface defects have been counted on 25 rectangular steel plates, and the data are shown in the table. Construct a c control chart for nonconformities using this data to study if the process is under control
جزاكم الله خيرا على حسن الاستماع هل من أسئلة ؟ 2000
حلول التطبيقات الباب 4 – خرائط الجودة للخواص د. محمد عيشـــوني m_aichouni@yahoo.co.uk أستاذ مساعد – قسم التقنية الميكانيكية - 2004
Ex 1 - Hometown Bank Sample Wrong Number Account Number 1 15 2 12 3 19 4 2 5 19 6 4 7 24 8 7 9 10 10 17 11 15 12 3 Total 147 The operations manager of the booking services department of Hometown Bank is concerned about the number of wrong customer account numbers recorded by Hometown personnel. Each week a random sample of 2,500 deposits is taken, and the number of incorrect account numbers is recorded. The records for the past 12 weeks are shown in the following table. Is the process out of control? Use 3-sigma control limits.
Control Charts for Attributes p-chart Sample Wrong Number Account Number 1 15 2 12 3 19 4 2 5 19 6 4 7 24 8 7 9 10 10 17 11 15 12 3 Total 147 n = 2500 Total defectives Total observations p =
p = 0.0049 Control Charts for Attributes p-chart Sample Wrong Proportion Number Account Number Defective 1 15 0.006 2 12 0.0048 3 19 0.0076 4 2 0.0008 5 19 0.0076 6 4 0.0016 7 24 0.0096 8 7 0.0028 9 10 0.004 10 17 0.0068 11 15 0.006 12 3 0.0012 Total 147 n = 2500
n = 2500 p = 0.0049 UCLp = p + zp = 0.0014 LCLp = p – zp = 0.0049 + 3 x 0.0014 = 0.0091 = 0.0049 - 3 x 0.0014 = 0.0007 p = p(1 – p)/n Control Charts for Attributes p-chart Hometown Bank
p Chart Wrong Account Numbers
Plate No. of No. Nonconformities 1 1 2 0 3 4 4 3 5 1 6 2 7 5 8 0 9 2 10 1 11 1 12 0 13 8 14 0 15 2 16 1 17 3 18 5 19 4 20 6 21 3 22 1 23 0 24 2 25 4 Construction of c Control charts Example 2 Surface defects have been counted on 25 rectangular steel plates, and the data are shown below. The control chart for nonconformities is set up using this data
The c chart Example 2