Download

1 / 4
50 likes | 236 Views
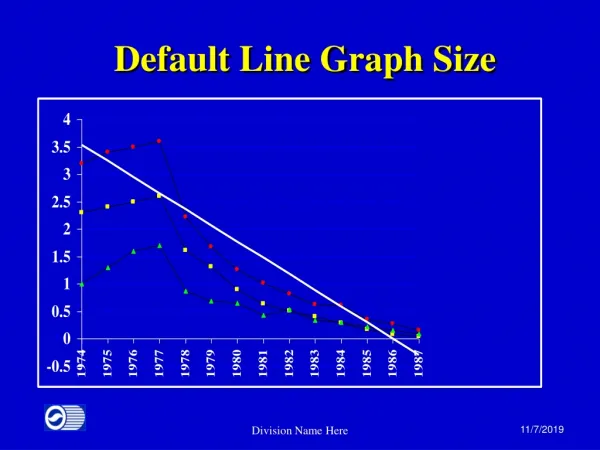
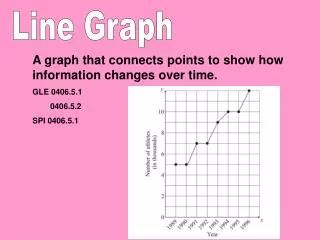
Creating a Line Graph. A step by step guide. Creating a Line Graph. Using the following data we will show how to draw a line graph. It is normal to place the variable quantity, in this case the temperature, on the y-axis.

E N D
Creating a Line Graph A step by step guide
Creating a Line Graph Using the following data we will show how to draw a line graph. It is normal to place the variable quantity, in this case the temperature, on the y-axis. Notice that the temperature ranges from -10 oC to 23 oC, this means that we will have to draw the y-axis to include negative values
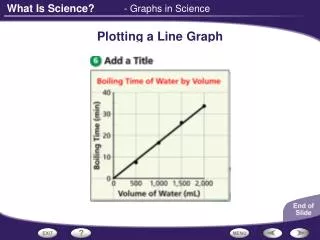
Temperature/Time Graph Creating a Line Graph 25 The first co-ordinate is at zero seconds and the temperature is -10oC (0,-10), let’s mark it with a cross. Lastly, add a title The second co-ordinate is 10,-5, again we will mark it with a cross. 20 Now repeat for all the other data, and draw a line to connect the points Now you try an example 15 Temperature (oC) As we have seen previously, we first need to draw vertical and horizontal axes, and insert the scales, in this case there are negative quantities, we therefore need to extend the y-axis below the line of the x-axis 10 5 0 60 10 20 30 40 50 Next we add the x and y axes labels Time (s) -5 -10
Creating a Line Graph Draw a line graph of the following data showing how much weight a person lost on a diet