Download
1 / 36
410 likes | 850 Views
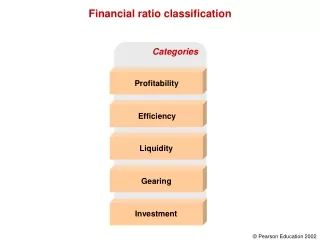
Financial Ratio Analysis. E. Ratio Analysis Calculations and What the Numbers Really Means. Liquidity ratios Activity ratios Leverage ratios Profitability Trends and graphs to spot problems Using an Excel template for instant “can’t miss” financial analysis. Using Financial Ratios.

E N D
Financial Ratio Analysis (c) 2001 Contemporary Engineering Economics
E. Ratio Analysis Calculations and What the Numbers Really Means • Liquidity ratios • Activity ratios • Leverage ratios • Profitability • Trends and graphs to spot problems • Using an Excel template for instant “can’t miss” financial analysis (c) 2001 Contemporary Engineering Economics
Using Financial Ratios (c) 2001 Contemporary Engineering Economics
Return on Equity (c) 2001 Contemporary Engineering Economics
Return on Equities (ROE) and Levels of Performance for 10 Diverse Companies (c) 2001 Contemporary Engineering Economics
Debt Management Analysis Leverage ratios that show how a firm uses debt financing and its ability to meet debt repayment obligations • Debt ratio • Debt to equity ratio • Times-interest-earned ratio (c) 2001 Contemporary Engineering Economics
Debt Ratio • Indicates how a firm finances its capital (c) 2001 Contemporary Engineering Economics
Times Interest Earned • Measures the extent to which earnings can decline without defaulting debt service. Note: Dell issued $500 million worth of senior notes and long-term bonds with a combined interest rate of 6.8%. (c) 2001 Contemporary Engineering Economics
Liquidity Analysis Ratios that show the relationship of a firm’s cash and other assets to its current liabilities (short-term obligations) • Current ratio • Quick ratio • Cash (liquidity) ratio (c) 2001 Contemporary Engineering Economics
Current Ratio • Measures a firm’s short-term solvency. • Formula: (c) 2001 Contemporary Engineering Economics
Quick Ratio • Excludes inventories and prepaid expenses • Formula: (c) 2001 Contemporary Engineering Economics
Liquidity Ratio • An indication of a firm’s immediate liquidity • Formula: (c) 2001 Contemporary Engineering Economics
Asset Management Analysis A set of ratios which measure how effectively a firm is managing its assets • Inventory turnover ratio • Days sales outstanding ratio • Total assets turnover ratio (c) 2001 Contemporary Engineering Economics
Activity Ratios • Measure how effectively the firm is using its resources • Days Sales Outstanding (DSO) • Inventory turnover (DSI) • Total asset turnover • Return on Assets (ROA) (c) 2001 Contemporary Engineering Economics
Inventory Turnover Ratio • Highlights the rate at which the inventory is being sold. The typical item sits in inventory almost 0.10 months (12 months/121.24) or 3 days before being sold (c) 2001 Contemporary Engineering Economics
Alternate Definition for Inventory Turnover Ratio (c) 2001 Contemporary Engineering Economics
Days Sales Outstanding (DSO) • Determines whether receivables are being collected aggressively enough. (c) 2001 Contemporary Engineering Economics
Days Sales in Inventory • What It Measures: The amount of inventory (stock) expressed in days of sales. For example, if 2 items a day are sold and 20 items are held in inventory, this represents 10 days' (20/2) sales in inventory. • How You Compute: The ratio computed by dividing inventory by cost of sales, and multiplied the result by 365 (c) 2001 Contemporary Engineering Economics
The Business Operating Cycle • Days Sales Outstanding = 26.66 days + Days Sales in Inventory = 3.84 days Total Days Operating Cycle = 30.50 days (c) 2001 Contemporary Engineering Economics
Total Asset Turnover Ratio • Indicates whether a company is generating a sufficient volume of business for the size of its asset investment. (c) 2001 Contemporary Engineering Economics
Profitability Analysis A set of ratios which show the combined effects of liquidity, asset management, and debt on operating results • Profit margin on sales • Return on total assets • Return on common equity (c) 2001 Contemporary Engineering Economics
Profitability Ratios • Measure management’s overall effectiveness as shown by the returns generated on sales and investment • Return on equity (return on investment) • Gross margin • Net margin • Book value per share • Earnings per share • Price to earnings ratio (P/E ratio) (c) 2001 Contemporary Engineering Economics
Gross Margin • Indicates the profitability of the sales effort. (c) 2001 Contemporary Engineering Economics
Net Margin • Illustrates what percentage of each sales dollar is retained in earnings. (c) 2001 Contemporary Engineering Economics
Return on Equity (ROE) • Measures the rate of return on the owner’s investment. (c) 2001 Contemporary Engineering Economics
How the Debt to Equity Ratio Impacts Return on Equity • This is an example of a healthy company that might not have a spectacular ROE because there is so much equity in the company. • This an example of a highly leveraged company that might have a spectacular ROE because the owners have put so little of their own resources into the company. Liabilities = Assets Equity = Liabilities Assets Equity (c) 2001 Contemporary Engineering Economics
Market Trend Analysis A set of ratios that relate the firm’s stock price to its earnings and book value per share • P/E ratio • Market/book ratio (c) 2001 Contemporary Engineering Economics
Earnings Per Share (EPS) • Indicates earnings attributable to each share of stock. • Widely used indicator of a corporation’s performance Net income available for distribution $2,122 Common shares outstanding 2,644 Earnings per share (EPS): $0.80 (c) 2001 Contemporary Engineering Economics
Price to Earnings Ratio • Indicates how many times a corporation is able to multiply its earnings in terms of asking price per share of stock. • Share price: $32 as of August 22, 2003 (c) 2001 Contemporary Engineering Economics
Book Value/Share • Indicates what the value of a share of stock is according to the books (financial statements). Total Assets $15,470 Total liabilities 10,597 Stockholders’ equity 4,873 Preferred stock obligation 0 Net worth assigned to common stockholders 4,873 Common shares outstanding 2,644 Net worth (Book value): $1.84 (c) 2001 Contemporary Engineering Economics
Market/Book Ratio • What It Measures: Indicates how investors regard the company – a higher ratio indicates that investors are willing to bet a higher return on investment • How You Compute: The ratio of a stock’s market price to its book value (c) 2001 Contemporary Engineering Economics
Trends and Graphs to Spot Problems • Trends analysis, where one plots a ratio over time, is important, because it reveals whether the firm’s ratios are improving or deteriorating over time. (c) 2001 Contemporary Engineering Economics
Limitations of Financial Ratios • Ratio analysis is useful, but analysts should aware of ever-changing market conditions and make adjustments necessary. • It is difficult to generalize about whether a particular ratio is good or bad. • Ratio analysis based on any one year may not represent the true business condition. (c) 2001 Contemporary Engineering Economics
Quick Financial Analysis Horizontal versus Vertical Analysis (c) 2001 Contemporary Engineering Economics
Horizontal Analysis • Determine the total dollar change (variance) from year to the next. • Determine the percent change (variance) from one year to the next (c) 2001 Contemporary Engineering Economics
Vertical Analysis • For the balance sheet, determine what percent of total assets each line item totals. • For the income statement, determine what percent of total sales each line item totals. (c) 2001 Contemporary Engineering Economics