Download

1 / 14
150 likes | 198 Views
Get prepared for the GRE Quantitative Section with essential math concepts, tips, and practice questions. Learn how to approach different types of problems effectively to ace this section of the exam.

E N D
Quantitative - GRE Jeff Stocco Career Center 9/22/04
Geography of the Quantitative Section • 45 minutes • 28 questions • 13 – 15 Quantitative Comparisons • 8 – 10 Problem Solving • 4 – 6 Chart Questions (2-3 charts)
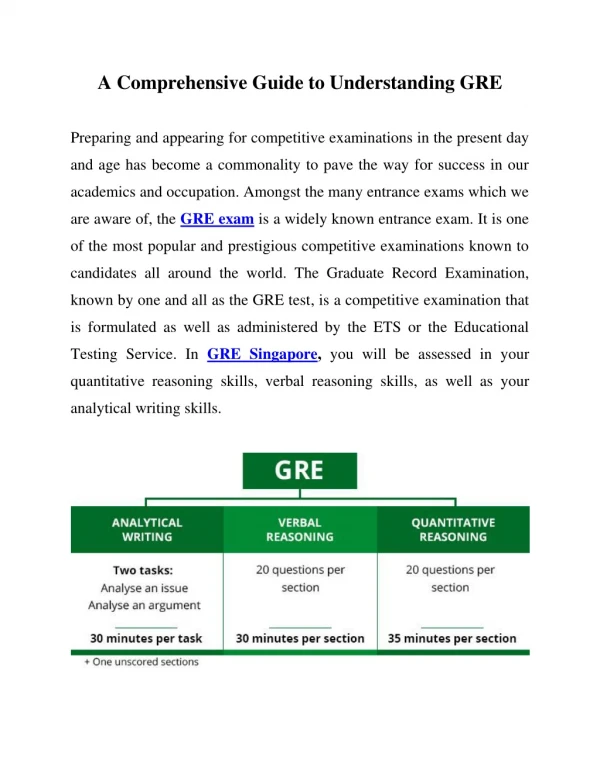
What math background is needed? • Needed • Arithmetic • Basic algebra • Basic geometry • Elementary statistics • NOT needed • Calculus (or pre-calculus) • Trigonometry • High-level algebra or geometry
How to prepare? • Review math facts • Chapters 10 – 12 Princeton Review • Learn tips and techniques • Chapters 9 – 12 Princeton Review • Practice, Practice, Practice! • Chapter 20 Princeton Review • Practice Questions, PowerPrep Software
Tackling regular math problems • Don’t assume drawings are to scale • “It cannot be determined” • Easy question: could be the answer • Difficult question: almost never the answer • Read and copy carefully • Work backward • Try the answers first (or substitute) • Plugging in numbers
A -2 B 0 C 2 D 3 E 4 Try 0 -3 < 5 Try 2 7 < 11 Try 3 12 < 14 Try –2 -13 < -1 Try 4 17 = 17 Therefore “E” Working backward – exampleWhich of the following values of a does not satisfy5a – 3 < 3a + 5 ?
A the square of an integer B a multiple of 5 C an even integer D an odd number E a prime number Use 2 & 3 Use 0 & 1 9 – 4 = 5 1 – 0 = 1 No - Yes No No - Yes Yes Yes No Plugging in – Example(Make up numbers and plug them in)The positive difference between the squares of 2 consecutive integers is always:
A 1 B 5 C 10 D 50 E 100 Approximate each value in the equation (.5) (500) = 5 250 = 50 5 therefore D Approximate – ExampleWhich of the following is the closest approximation of the value of (0.507) (507) ? 5.07
“Trap Answers” - example The price of a jacket was reduced by 10%. During a special sale, the price was discounted another 10%. What was the total percentage discount from the original price of the jacket? A 15% B 19% Which is the “trap answer”? C 20% (the one that seems too easy) D 21% E 25%
Charts • 4 – 5 questions per chart or graph • Grids • Bar graphs • Pie charts • Tables • Draw your own picture if it helps • All are special cases of general math
Quantitative Comparisons • Only 4 choices • A is Column A always greater? • B is Column B always greater? • C are they always equal? • D none of the above (can’t be determined) • If the questions has only numbers, • D cannot be correct!
Quantitative Comparisons • Avoid Computation (when you can) • Example Area of a circle, diameter 12 Surface area of a sphere, diameter 12 Solve: Picture a circle of 12” diameter Picture a ball of 12” diameter Which one would have a larger surface area? Do you need to use formulas?
Quantitative Comparisons • Avoid lengthy calculations (when you can) • Example A B 9 (3 + 24) ? (9 X 3) + (9 X 24) = 9 (3 + 24)