Download
1 / 9
90 likes | 275 Views
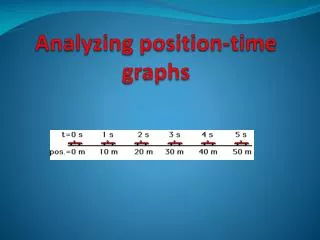
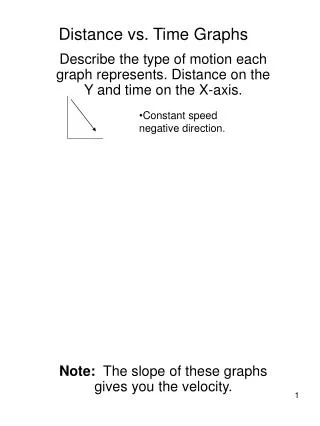
Time vs. Position Graphs. Representing One-Dimensional Motion Graphically. Time vs. Position Graphs. Details the location of an object, relative to the reference point, over a specified period of time Time is Independent variable (x-axis) Position is Dependent variable (y-axis).

E N D
Time vs. Position Graphs Representing One-Dimensional Motion Graphically
Time vs. Position Graphs • Details the location of an object, relative to the reference point, over a specified period of time • Time is Independent variable (x-axis) • Position is Dependent variable (y-axis)
Time vs. Position Graph #1 • What is the position of swimmer #1 at 20 sec? • How far ahead of swimmer #2 is swimmer #1 at 20 sec? • What is the displacement of swimmer #1 from 10-40 sec? • Which swimmer is faster? How can you tell?
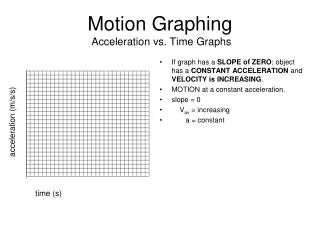
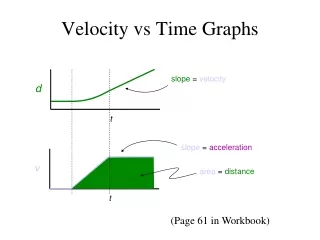
Velocity on a Time vs. Position Graph • Units of the slope? • m/s • Slope of a time vs. position graph tells the velocity
Slope of Time vs. Position Graphs Describe the motion of the object
Slope of Time vs. Position Graphs What’s happening to the slope of the curve?
Slope of Time vs. Position Graphs On a t vs. x graph that is curved, the slope of the TANGENT LINE tells the INSTANTANEOUS VELOCITY
What can be determined from a time vs. position graph? • Instantaneous Position • Where is the object at a specific moment in time? • Displacement • The change in position over a period of time • Velocity • What is the object currently doing?