Download
1 / 28
290 likes | 599 Views
Monitoring of habitat types in the Netherlands. Rense Haveman & John Janssen. Content. Introduction Why monitoring? Requirements Present state Natura 2000 Part 1. EU-report June 2007 Part 2. Future monitoring. Why monitoring habitat types?. (1) EU-report (every 6 years)

E N D
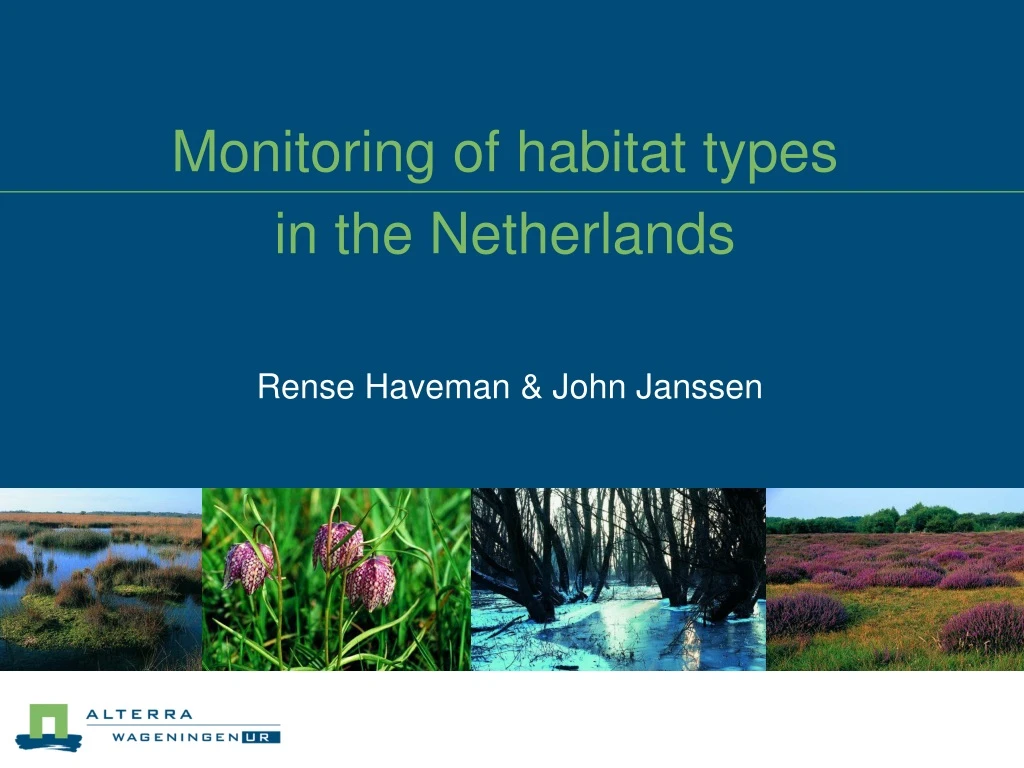
Monitoring of habitat typesin the Netherlands Rense Haveman & John Janssen
Content Introduction Why monitoring? Requirements Present state Natura 2000 Part 1. EU-report June 2007 Part 2. Future monitoring
Why monitoring habitat types? (1) EU-report (every 6 years) Monitoring on national level Responsibility: Ministry LNV (2) Standard Data Forms (update every 6 year) (3) Evaluation management (site goals) (4) Environmental Impact Assessment Monitoring on site level Responsibility: different organizations Update SDFs: Ministry LNV
Required data EU-Report conservation status (51 habitat types): • Distribution, range + trend • National area + trend • Structure & function + typical species (quality) • Future prospects • CS score (traffic light approach) Site level: • Location and area + trend • Quality (Structure & function + species composition) + trend • Abiotic conditions • Relation with management and activities
Part 1. EU-report June 2007 Basic information: in habitat type ‘profiles’ http://www2.minlnv.nl/thema/groen/natuur/natura2000_2006/achtergrond.htm Overview of habitat types with: definition abiotic conditions typical species distribution trends Conservation Status scores goals at a national level
EU-report June 2007 Range based on National Vegetation Database Area Literature, sum of sites, expert knowledge Structure & function profiles (expert knowledge, literature) Future prospects profiles Conservation Status profiles
Definition Structure & function vs Future prospects Structure & function: • Conditions directly influencing species composition of the community + species composition itself (typical species) • Structure, buffering of soil, pH, hydrological conditions at the site… Future prospects • Conditions indirect influencing species composition (further away, higher scale level); effects are not (always) yet measurable in species composition • Atmospheric deposition, habitat fragmentation, management, regional hydrological system
Example 6120* Xeric sand grasslands Distribution
Example 6120* Xeric sand grasslands Trend • < 1975 1975-2005
Example 6120* Xeric sand grasslands Trend negative
Example 6120* Xeric sand grasslands Trend negative 600 ha (1950) 30 ha (1994) Improved by restoration projects
Example 6120* Xeric sand grasslands Red List Artemisia campestris ssp campestris Veronica prostrata Carex ligerica Euphorbia seguieriana Hippocrepis comosa† Orobanche lutea etc.. Trend negative 600 ha (1950) 30 ha (1994) Improved by restoration projects
Example 6120* Xeric sand grasslands Red List Artemisia campestris ssp campestris Veronica prostrata Carex ligerica Euphorbia seguieriana Hippocrepis comosa† Orobanche lutea etc.. Trend negative 600 ha (1950) 30 ha (1994) Improved by restoration projects Most locations suffer from eutrophication, inadequate management, acidification (no buffering) and loss of hydrological dynamics
Example 6120* Xeric sand grasslands Red List Artemisia campestris ssp campestris Veronica prostrata Carex ligerica Euphorbia seguieriana Hippocrepis comosa† Orobanche lutea etc.. Trend negative 600 ha (1950) 30 ha (1994) Atmospheric condition poor, fragmentized Improved by restoration projects Most locations suffer from eutrophication, inadequate management, acidification (no buffering) and loss of hydrological dynamics
Natura 2000: present status Site goals Based on CS scores and relative importance of sites: conservation goals have been formulated for all Natura 2000 sites (now under public consultation) - Conservation of area / quality of types - Increase of area - Improvement of quality These goals will be worked out in detail (space and time) within management plans next years
Part 2. Future monitoring System under development • More based on data, less on expert knowledge • Efficient • Sensible for changes • Using data from existing monitoring programs • Many organizations involved in nature monitoring • Different methods may be used (within quality demands) • Information from sites used for national report (up-scaling) • Use data from last 12 year for each 6 year report • If CS is favorable: lower effort
Future monitoring Two options studied • National monitoring program • Using a random stratified sample + distribution data • existing data: NEM (permanent plots), distribution data species and plant communities • Site monitoring program + up-scaling to national level • Using vegetation maps etc. • existing data: from site managers
Future monitoring Option 1 (national program) • Pioneer types • Small area within sites • Dynamical types • Large part outside Natura 2000 • Example: 2110 (embryonic dunes), 3130 (oligotrophic pools), 3270 (pioneer vegetation along rivers) • Option 2 (site program + up-scaling) • Stable types, mainly situated within Natura 2000 • Example: grasslands, heathlands, salt marsh, forest types
Future monitoring Range mainly National Vegetation Databank Area Partly from sites (vegetation maps) Central Database Habitat Maps Partly from national sample, distribution data, … (less accurate) Future prospects Expert knowledge, according to a certain protocol
Monitoring per aspect Quality (structure & function + typical species) Options (or a combination): • Quality maps (good/poor) on site level • based on size, structure, vegetation type, species composition, etc… • national scale up-scaling • example: salt-marshes (1330) • National sample (abiotic, biotic) • according to Water Framework monitoring, NEM (permanent plots), …. • example: oligotrophic pools, some forests, … • Using vegetation distribution data • explore change in species composition of relevés • example: pioneer vegetation river banks • Status typical species (on a national level) • using distribution data, frequency or Red List-status
Example 2130 Grey Dunes Three subtypes, large areas, many typical species, large problems (grass and shrub encroachment) Option 1: Quality maps on site level (up-scaling) or Option 2: Using permanent plot data (NEM) and Option 4: assessing status of typical species
Example 7210 Cladium mariscus - vegetation Small areas, one typical species, one permanent plot in NEM Option 3: Distribution data of plant community: percentage of sites with well developed form (containing Caricion davallianae species)
Future monitoring: summary • Still under development • Different approach for different (groups) of habitat types • Dependent on character of habitat types, existing monitoring programs, conservation status, distribution within and outside Natura 2000, money • Combine data on national and site level • (if possible)
Approach in other countries We are very interested in your approach !!