Download
1 / 26
300 likes | 423 Views
Explore the concept of shrinkage in Bayesian statistics for more accurate estimation of population means in psychological science. Learn how the James-Stein estimator minimizes squared error and enhances prediction accuracy.

E N D
Shrinkage Greg Francis PSY 626: Bayesian Statistics for Psychological Science Fall 2018 Purdue University
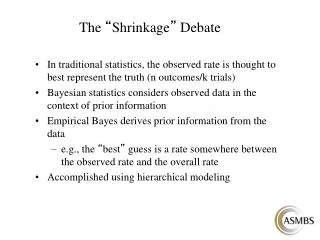
Estimation • Suppose you want to estimate a population mean from a normal distribution • The standard approach is to use the sample mean • Indeed, the sample mean is an unbiased estimate of the population mean • It is the value that minimizes squared error, relative to the sample: • It is also the Maximum Likelihood Estimate of the population mean • It is hard to do better than this! X3 X1 X4 X2
Estimation • Suppose you want to estimatethe population mean from a normal distribution with mean μ and standard deviation σ • You want to minimize squared error: • You cannot do better (on average) than the sample mean • For sample size n, the expected squared error will be
Estimation • Suppose you want to estimate p=5 population means by minimizing mean squared error • You might try using the sample means • Suppose the populations all have the same standard deviation but different means μi • This would give an MSE of
Sample means • Let’s try some simulations • n=20 for each sample • σ=1 (assumed to be known to us) • μi selected from a normal distribution N(0, 1) • Average MSE=0.2456 • You might think this is as good as you can do • But you can do rather better
Shrinkage • Consider a different (James-Stein) estimate of the population means • This estimateproduces a population mean estimate closerto 0 than the sample mean
Shrinkage • Consider a different (James-Stein) estimate of the population means • This estimateproduces a population mean estimate closerto 0 than the sample mean • (Sometimes just a bit)
Shrinkage • Consider a different (James-Stein) estimate of the population means • This estimateproduces a population mean estimate closerto 0 than the sample mean
Shrinkage • Shrinking each sample mean toward 0 decreases (on average) the MSE • Average MSE(Sample means)=0.2456 • Average MSE (James-Stein)=0.2389 • In fact, the James-Stein estimator has a smaller MSE than the sample means for 62% of the simulated cases • This is true despite the fact that the sample mean is a better estimate for each individual mean!
Shrinkage • You might think the James-Stein estimators work only by shrinking every estimate toward the mean of the population means • [μi selected from a normal distribution N(0, 1)] • There is an advantage when you have such information, but shrinkage can help (on average) by shrinking toward any value • When v is far from the sample means, the denominator tends to be large, so the adjustment is close to 1
Shrinkage • Set v=3 • Not much change,but still a smalldrop in MSE
Shrinkage • Set v=3 • Not much change,but here a smalldecrease in MSE • Average MSE for v=3 is 0.2451 • (Compared to 0.2456 for samplemeans) • These estimates beatthe sample means in 54% of cases
Shrinkage • Set v=30 • Not much change,but still a smalldrop in MSE • Average MSE for v=30 is 0.2456 • (Compared to 0.2456 for samplemeans) • These estimates beatthe sample means in 50.2% of cases
Shrinkage • There is a “best” value of v that will minimize MSE, but you do not know it • Even a bad choice tends to help (on average), albeit not as much as is possible, and it does not hurt (on average) • There is a trade off • You have smaller MSE on average • You increase MSE for some cases and decrease it for other cases • You never know which case you are in • These are biased estimates of the population means
Shrinkage • These effects have odd philosophical implications • If you want to estimate a single mean (e.g., the IQ of psychology majors, mathematics majors, English majors, physics majors, or economics majors) • You are best to use the sample mean • If you want to jointly estimate the mean IQs of these majors • You are best to use the James-Stein estimator • Of course, you get different answers for the different questions! • Which one is right? There is no definitive answer! • What is truth?
Shrinkage • It is actually even weirder! • If you want to jointly estimate • Family income • Mean number of windows in apartments in West Lafayette • Mean height of chairs in a classroom • Mean number of words in economics textbook sentences • The speed of light • You are better off using a James-Stein estimator than the sample means • Even though the measures are unrelated to each other! • (You may not get much benefit, because the scales are so very different.) • You get different values for different units
Using wisely • You get more benefit with more means being estimated together • The more complicated your measurement situation, the better you do! Compare to hypothesis testing, where controlling Type I error becomes harder with more comparisons!
Data driven • There is a “best” value of v that will minimize MSE, but you do not know it • Oftentimes, a good guess is the average of the sample means • Called the Morris-Efron estimator • Sometimes use (p-3) instead of (p-2)
Morris-Efron estimators • Not quite as good as James-Stein when population means come from N(0,1) • n=20, p=5 • MSE(samples means) = 0.2456 • MSE(James-Stein)= 0.2389, beats sample means 62% • MSE(Morris-Efron) = 0.2407, beats sample means 59% • Better if population means come from N(7,1) • n=20, p=5 • MSE(samples means) = 0.2456 • MSE(James-Stein)= 0.2454, beats sample means 51% • MSE(Morris-Efron) = 0.2407, beats sample means 59%
Why does shrinkage work? • MSE can be split up into bias and variance • Consider a single mean, i, • Expand the square
Bias and variance • Apply the expectation to the terms • The last term is unaffected by the expectation (it is a constant) • In the middle term, the second difference is a constant and can be pulled out, same for the number 2
Bias and variance • Apply the expectation to the middle terms • The double expectation is just the expectation, so the middle term equals 0 • The term on the left is variance of the estimator • The term on the right is the square of bias
MSE and shrinkage • Sample means are unbiased estimators of population means, so the second term equals 0 • MSE is all about variance • James-Stein and Morris-Efron estimators are biased estimators, but they have a smaller variance than sample means (because they are shrunk toward a fixed value) • The trade-off works only for p>2
Prediction • Shrinkage works for prediction too! • Suppose you have 5 population means drawn from N(0,1) • You take samples of n=20 for each population • You want to predict sample means for replication samples, Y • Your criterion for the quality of prediction is MSE
Prediction • Averaged across 1000 simulations • n=20, p=5 • MSErep(samples means) = 0.5028 • MSErep (James-Stein)= 0.4968, beats sample means 57% • MSErep (Morris-Efron) = 0.4988, beats sample means 54% • Larger MSE values than previous simulations because there is variability in the initial sample and in the replication sample
Conclusions • Shrinkage demonstrates that there is no universally appropriate estimator or predictor • How to estimate/predict depends on what you want to estimate/predict • Shrinkage can be used in frequentist approaches to statistics • Lasso, regularization, ridge regression, hierarchical models, (random effects) meta-analysis • Shrinkage falls out naturally from Bayesian approaches to statistics • Hierarchical models • Priors do not matter very much!