Download
1 / 18
180 likes | 248 Views
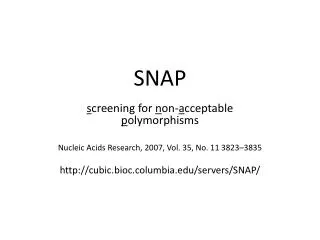
Surveying the Universe with SNAP. Tim McKay University of Michigan Department of Physics Seattle AAS Meeting: 1/03 For the SNAP collaboration. The Supernova/Acceleration Probe. Mostly pure survey mode Step and stare across the sky, each location seen in all nine filters

E N D
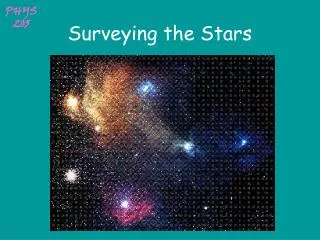
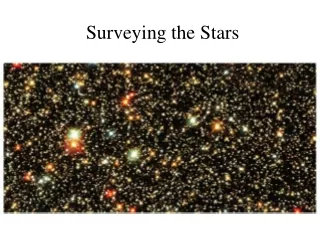
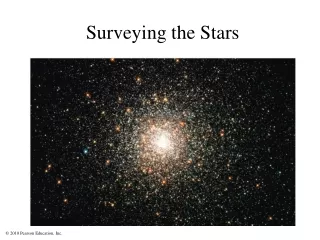
Surveying the Universe with SNAP Tim McKay University of Michigan Department of Physics Seattle AAS Meeting: 1/03 For the SNAP collaboration
The Supernova/Acceleration Probe • Mostly pure survey mode • Step and stare across the sky, each location seen in all nine filters • Dithered exposures at each location • Two surveys: a deep, time domain SNe survey and wide single pass weak lensing survey A space based optical/near-IR survey telescope Large field of view coupled with 0.1” resolution and broad coverage
SNAP Deep & Time Domain Survey • Base SNAP survey: 15 square degrees near ecliptic poles • ~6000x as large as ACS deep field, to mAB=30.4 in nine optical and IR bands • Provides ≥ 100 epochs over 16 months (each to mAB=27.8) for time domain studies in all nine bands Hubble Deep Field GOODS Survey area
SNAP Wide Weak Lensing Survey • ~300 square degree ‘wide’ survey surrounding each of the deep fields • Roughly five months of observing time • Four dithered 500 second exposures at each location; sensitive to mAB=28.1 • Every field observed in all nine optical NIR filters Hubble Deep Field GOODS Survey area
Depth From the disk to z=10 Depth in the time domain; R~27.8 in each epoch Optical + NIR 9 bands = Low resolution spectroscopy (R~7) Available in time domain NIR follows Lyman- emission to z=12 Image quality High resolution PSF stability Photometric stability Some of the topics impacted: Galaxy studies: evolution and clustering, a census of R, I, z, and J band dropout galaxies Galaxy clusters: identification of high redshift galaxy clusters, faint and small constituents High-z quasar studies: mapping the quasar luminosity function to z=10, probing the structure of reionization Transients; GRBs, QSO/AGN, outer solar system objects Cool stars in the Milky Way Lensing: evolution of the galaxy-mass correlation to z=1, cluster masses, etc. Targets: Identification of targets for JWST, CELT, etc… SNAP imaging surveys are unique
HDF’s illustrate the potential impact of SNAP studies Large area observations required to probe environmental effects at each redshift High resolution for structure and population studies Photo-z: 4000Å break for z=0-3.0 Ly- break for z=3.3-12 NIR for dust and high z ≥5x10⁷ galaxies with photoz Galaxy evolution and photo-z Family of Galaxy Spectra: Budavari et al.
Simulated SNAP Photo-z • Expected photo-z performance for SNAP multiband survey is excellent (z~0.04/galaxy) • Spatially resolved color gives photo-z + stellar population information Photometric z Single band image SFR per pixel Spectroscopic z Conti & Connolly: Jan. 2002 AAS
Evolution of Galaxy Clustering J. Colberg, VIRGO simulations: Jenkins et al, 1998 ApJ,499,20-40 • Photo-z defines redshift sheets • Evolution of 2D clustering • 12 nearly independent redshift sheets from z=0-3 • Optical/NIR covers restframe optical out to z=3, simplifying evolution studies • Wide fields substantially reduce sensitivity to cosmic variance constraints Conti and Connolly Jan 2002 AAS Relative Error 10% Linear survey size (h-1 Mpc)
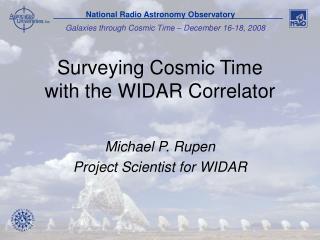
Important markers of structure formation which form relatively late. dn/dz exquisitely sensitive to cosmology; alternate dark energy probe? Widefield multicolor CCD data has revitalized optical cluster finding Cluster members are the reddest galaxies at each redshift Clusters in position-color space Finding clusters in SNAP data Z=0.165 SDSS image of Abell 1553
Identification of high-z clusters • Clustering in position-color space essentially eliminates contamination by projection • Gladders & Yee (2000), Goto et al. (2001), Annis et al. (2002) • E/SO ridgeline provides extremely accurate (z0.01) photometric redshift • Red sequence in place at z>1 E/SO ridgeline g-r color i magnitude Red sequence galaxies at z=1.27 (van Dokkum et al, 2000)
Z=0.138 Z=0.041 Z=0.277 Z=0.377 Example color cluster images from the SDSS
Expected SNAP cluster counts 15 square degree survey still suffers from cosmic variance. 300 square degree lensing survey will be more useful for cluster counts N (M>5x10¹³ M) in 15 sq. deg. Based on Virgo consortium Hubble Volume CDM Simulations z=2 z=1 Redshift in bins of 0.02 z=3
Quasar evolution to z>12 • Quasar identification through multicolor observations • Further selection through variability • Good QSO redshift estimates through photoz • Depth extends to 1000x less luminous objects • NIR extends to much higher redshift (from 6.3-12) SDSS QSO color selection Fan et al., AJ, 2000
Setting up reionization probes • Highest redshift SDSS QSO’s show evidence for Gunn-Peterson absorption associated with neutral IGM • Possibly seeing edge of reionization epoch • Structure in reionization is unknown: caused by variations in UV flux from early stars + quasars • SNAP discovered z>6 QSO’s, with NGST spectroscopy, can map the spatial structure of reionization Pentericci et al, 2001 z=6.3 quasar f(erg cm-2 s-1 A-1) Wavelength Fan et al., 2002 Gunn-Peterson Optical Depth Redshift
Quasar number counts X. Fan, based on SDSS QSO LF Quasars per square degree Z > 5 Z > 7.5 Z > 10 One in SNAP deep survey AB magnitude
Beyond cosmology: galaxy and cluster studies To measure lenses at z=1.0 requires many sources at z~3.0 Ground based studies resolve galaxies to R~25, this limits available sources To study lenses at and beyond z=1 requires space based NIR observations Evolution of galaxy-mass correlation function Mass selected galaxy cluster number density and clustering Mass maps of filaments SNAP high-z weak lensing studies
Why go so faint? 30 28 25 Lensing S/N is much higher for a deeper space based survey. Sensitivity tilted to low-z. Basic geometry is similar for the three surveys. Sensitivity changes due to available source density.
Wide area surveys have always fed massive spectroscopic instruments Palomar 48” > 200” SDSS > 8-10m’s SNAP > JWST, CELT and other next generation ground-based telescopes Biggest HST deep survey will be ACS survey: 6300x smaller than SNAP main survey About as deep SNAP NIR survey capabilities especially important SNAP Surveys and NG Telescopes