Download
1 / 38
400 likes | 513 Views
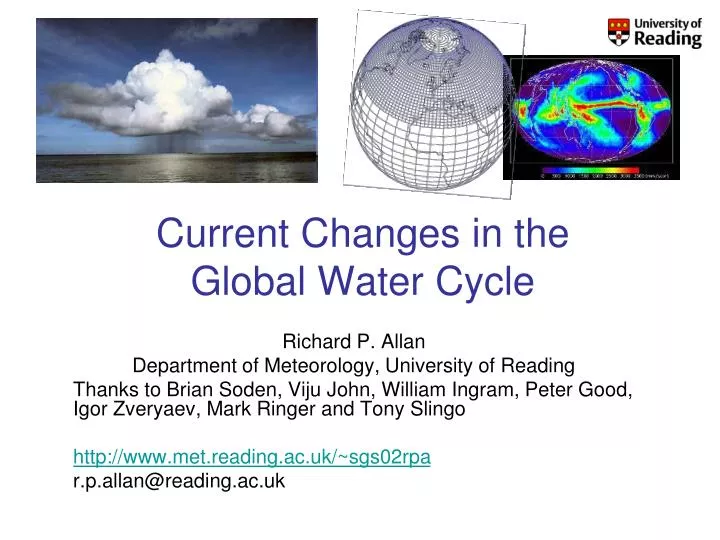
Current Changes in the Global Water Cycle. Richard P. Allan Department of Meteorology, University of Reading Thanks to Brian Soden, Viju John, William Ingram, Peter Good, Igor Zveryaev, Mark Ringer and Tony Slingo http://www.met.reading.ac.uk/~sgs02rpa r.p.allan@reading.ac.uk. Introduction.

E N D
Current Changes in the Global Water Cycle Richard P. Allan Department of Meteorology, University of Reading Thanks to Brian Soden, Viju John, William Ingram, Peter Good, Igor Zveryaev, Mark Ringer and Tony Slingo http://www.met.reading.ac.uk/~sgs02rpa r.p.allan@reading.ac.uk
Introduction “Observational records and climate projections provide abundant evidence that freshwater resources are vulnerable and have the potential to be strongly impacted by climate change, with wide-ranging consequences for human societies and ecosystems.” IPCC (2008) Climate Change and Water
How should the water cycle respond to climate change? Precipitation Change (%) relative to 1961-1990: 2 scenarios, multi model (IPCC, 2001) See discussion in: Allen & Ingram (2002) Nature; Trenberth et al. (2003) BAMS
Climate model projections (IPCC 2007) Precipitation Intensity • Increased Precipitation • More Intense Rainfall • More droughts • Wet regions get wetter, dry regions get drier? • Regional projections?? Dry Days Precipitation Change (%)
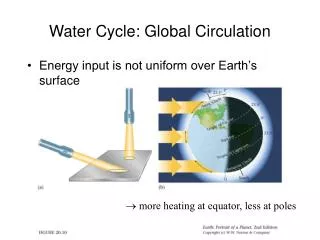
Physical basis: energy balance Trenberth et al. (2009) BAMS
Evaporation Richter and Xie (2008) JGR CC Wind Ts-To RHo Muted Evaporation changes in models are explained by small changes in Boundary Layer:1) declining wind stress2) reduced surface temperature lapse rate (Ts-To)3) increased surface relative humidity (RHo)
Physical Basis: clear-sky radiative cooling: models simulate robust response of clear-sky radiation to warming (~2 Wm-2K-1) & resulting precipitation increase e.g. see Stephens and Ellis (2008); Lambert and Webb (2008) GRL Radiative cooling, clear(Wm-2) Latent Heat Release, LΔP (Wm-2) Lambert & Webb (2008) GRL Surface Temperature (K)
Physical basis: water vapour 1979-2002 • Clausius-Clapeyron • Low-level water vapour (~7%/K) • Intensification of rainfall: Trenberth et al. (2003) BAMS; Pall et al. (2007) Clim Dyn • Changes in intense rainfall also constrained by moist adiabat -O’Gorman and Schneider (2009) PNAS • Could extra latent heat release within storms enhance rainfall intensity above Clausius Clapeyron? • e.g. Lenderink and van Meijgaard (2008) Nature Geoscience
Clausius-Clapeyron Low-level water vapour (~7%/K) Enhanced moisture transport (F) Enhanced P-E patterns (below) See Held and Soden (2006) J Clim Physical basis: water vapour AR5 scaling
Circulation response P~Mq Models/observations achieve muted precipitation response by reducing strength of Walker circulation. Vecchi and Soden (2006) Nature
Contrasting precipitation response expected Heavy rain follows moisture (~7%/K) Mean Precipitation linked to radiation balance (~3%/K) Precipitation Light Precipitation (-?%/K) Temperature e.g.Held & Soden (2006) J. Clim; Trenberth et al. (2003) BAMS; Allen & Ingram (2002) Nature
The Rich Get Richer? Is there a contrasting precipitation responses in wet and dry regions? Some limited observational evidence, e.g. Zhang et al. (2007) Nature Models ΔP [IPCC 2007 WGI] Precip trends, 0-30oN Rainy season: wetter Dry season: drier Chou et al. (2007) GRL
Current changes in the water cycleAs observed by satellite datasets and simulated by modelsFocus on tropical oceans.
Current changes in tropical ocean column water vapour John et al. (2009) Water Vapour (mm) models …despite inaccurate mean state, Pierce et al.; John and Soden (both GRL, 2006) - see also Trenberth et al. (2005) Clim. Dyn., Soden et al. (2005) Science
Sensitivity of water vapour and clear-sky radiation to surface temperature ERA40 NCEP ERAINT SSM/I ERA40 NCEP SRB SSM/I ERA40 NCEP SRB SSM/I Allan (2009) J . Climate
Models simulate robust response of clear-sky radiation to warming (~2 Wm-2K-1) and a resulting increase in precipitation to balance (~2 %K-1)e.g. Allen and Ingram (2002) Nature, Stephens & Ellis (2008) J. Clim Allan (2006) JGR Radiative cooling, clear (Wm-2K-1) NCAS-Climate Talk 15th January 2010
Trends in clear-sky radiation in coupled models Surface net clear-sky longwave Clear-sky shortwave absorption Can we derive an observational estimate of surface longwave? Prata (1996) QJRMS
Variability in clear-sky radiative cooling John et al. (2009) GRL
Tropical ocean variation in water vapour and precipitation Precip. (%) Allan and Soden (2008) Science NCAS-Climate Talk 15th January 2010
Tropical ocean precipitation • dP/dSST: GPCP: 10%/K(1988-2008) AMIP: 3-11 %/K(1979-2001) • dP/dt trend GPCP: 1%/dec (1988-2008) AMIP: 0.4-0.7%/dec (1979-2001) (land+ocean) SSM/I GPCP
Contrasting precipitation response in wet and dry regions of the tropical circulation ascent Observations Models Precipitation change (%) descent Sensitivity to reanalysis dataset used to define wet/dry regions Updated from Allan and Soden (2007) GRL
GPCP Ascent Region Precipitation (mm/day) Is the contrasting wet/dry response robust? John et al. (2009) GRL • Large uncertainty in magnitude of change: satellite datasets and models & time period TRMM • Robust response: wet regions become wetter at the expense of dry regions. Is this an artefact of the reanalyses?
Avoid reanalyses in defining wet/dry regions • Sample grid boxes: • 30% wettest • 70% driest • Do wet/dry trends remain?
Current trends in wet/dry regions of tropical oceans • Wet/dry trends remain • 1979-1987 GPCP record may be suspect for dry region • SSM/I dry region record: inhomogeneity 2000/01? • GPCP trends 1988-2008 • Wet: 1.8%/decade • Dry: -2.6%/decade • Upper range of model trend magnitudes DRY WET Models
Precipitation Extremes • Trends in tropical wet region precipitation appear robust. • What about extreme precipitation events? • Analyse daily rainfall over tropical oceans • SSM/I v6 satellite data, 1988-2008 (F08/11/13) • Climate model data (AMIP experiments) • Create rainfall frequency distributions • Calculate changes in the frequency of events in each intensity bin • Does frequency of most intense rainfall rise with atmospheric warming? METHOD
Increases in the frequency of the heaviest rainfall with warming: daily data from models and microwave satellite data (SSM/I) Reduced frequency Increased frequency Updated from Allan and Soden (2008) Science
Increase in intense rainfall with tropical ocean warming (close to Clausius Clapeyron) • SSM/I satellite observations at upper range of model range Model intense precipitation dependent upon conservation of moist adiabatic lapse rate but responses are highly sensitive to model-specific changes upward velocities (see O’Gorman and Schneider, 2009, PNAS; Gastineau & Soden 2009).
One of the largest challenges remains improving predictability of regional changes in the water cycle… Changes in circulation systems are crucial to regional changes in water resources and risk yet predictability is poor. How will catchment-scale runoff and crucial local impacts and risk respond to warming? What are the important land-surface and ocean-atmosphere feedbacks which determine the response?
Precipitation in the Europe-Atlantic region (summer) Dependence on NAO
Current changes water cycle variables: Europe-Atlantic region Water vapour Temperature NCAS-Climate Talk 15th January 2010
Current changes water cycle variables: Europe-Atlantic region Evaporation Precipitation
Outstanding issues • Are satellite estimates of precipitation, evaporation and surface flux variation reliable? • Are regional changes in the water cycle, down to catchment scale, predictable? • How well do models represent land surface feedbacks. Can SMOS mission help? • How is the water cycle responding to aerosols? • Linking water cycle and cloud feedback issues
How does the hydrological cycle respond to different forcings? Andrews et al. (2009) J Climate Partitioning of energy between atmosphere and surface is crucial to the hydrological response; this is being assessed in the PREPARE project
Mishchenko et al. (2007) Science Could changes in aerosol be imposing direct and indirect changes in the hydrological cycle? e.g. Wild et al. (2008) GRL Wielicki et al. (2002) Science; Wong et al. (2006) J. Clim; Loeb et al. (2007) J. Clim
Are the issues of cloud feedback and the water cycle linked? 2006 Allan et al. (2007) QJRMS How important are cloud microphysical processes in stratocumulus and large-scale processes involving cirrus outflow? e.g. Ellis and Stephens (2009) GRL; Stephens and Ellis (2008) J Clim. Zelinka and Hartmann (in prep) “FAT/FAP hypothesis”
Are the issues of cloud feedback and the water cycle linked? 2007 Allan et al. (2007) QJRMS How important are cloud microphysical processes in stratocumulus and large-scale processes involving cirrus outflow? e.g. Ellis and Stephens (2009) GRL; Stephens and Ellis (2008) J Clim. Zelinka and Hartmann (in prep) “FAT/FAP hypothesis”
Are the issues of cloud feedback and the water cycle linked? 2008 Allan et al. (2007) QJRMS How important are cloud microphysical processes in stratocumulus and large-scale processes involving cirrus outflow? e.g. Ellis and Stephens (2009) GRL; Stephens and Ellis (2008) J Clim. Zelinka and Hartmann (in prep) “FAT/FAP hypothesis”
Conclusions • Robust Responses • Low level moisture; clear-sky radiation • Mean and Intense rainfall • Observed precipitation response at upper end of model range? • Contrasting wet/dry region responses • Less Robust/Discrepancies • Moisture at upper levels/over land and mean state • Inaccurate precipitation frequency distributions • Magnitude of change in precipitation from satellite datasets/models • Further work • Decadal changes in global energy budget, aerosol forcing effects and cloud feedbacks: links to water cycle? • Precipitation and radiation balance datasets: forward modelling • Surface feedbacks: ocean salinity, soil moisture (SMOS?) • Boundary layer changes and surface fluxes