Download
1 / 32
320 likes | 419 Views
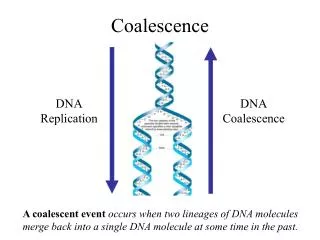
Coalescence, Caloric Curves and Critical behavior.

E N D
Coalescence, Caloric Curves and Critical behavior R. Alfarro,5 J. Cibor,4 M. Cinausero,2 Y. El Masri 6,D. Fabris,3 E. Fioretto,2K. Hagel1, A. Keksis1, T. Keutgen,6M. Lunardon,3Y. Ma1, Z. Majka,4 A. Makeev1,E. Martin1, A. Martinez-Davalos,5 A. Menchaca-Rocha,5 M. Murray1, J. B. Natowitz1, G. Nebbia3, L. Qin1, G. Prete,2 V. Rizzi,3 A. Ruangma1, D. V. Shetty1, P. Smith1, G. Souliotis1, P. Staszel,4 M. Veselsky1, G. Viesti,3R. Wada1, J. Wang1, E. M. Winchester1and S. J. Yennello1 1Texas A&M University, College Station, Texas 2INFN Laboratori Nazionali di Legnaro, Legnaro, Italy 3INFN Dipartimento di Fisica, Padova, Italy 4Jagellonian University, Krakow, Poland 5UNAM, Mexico City, Mexico 6UCL, Louvain-la-Neuve, Belgium The NIMROD Collaboration
Community Consensus Caloric Curves From the existing data Caloric curves can be defined in different mass regions Results from quite varied entrance channel systems, reaction dynamics and projectile energy ranges appear to be consistent. Only the lightest nuclei have been investigated to very high excitation There appears to be a mass dependence in the Caloric Curves J.B. Natowitz et al., Phys.Rev. C 65 034618 (2002)
Critical Temperature of Symmetric Nuclear Matter 16.6 0.86 MeV
Lyapunov Exponents in Molecular Dynamics CalculationsC.O. Dorso and A. Bonasera, Eur. Phys. J. A, 421 (2001) “MLE reaches a maximum for that energy for which the fluctuations are maximal and where we expect to find critical behavior.”
Limiting Temperatures and Critical ?Behavior “Limiting T and E*” – Black “Nucleus Critical T and Ex/A ”- Colored J. B. Natowitz et al., Phys. Rev. C 65, 034618 (2002). Limiting Temperatures D. d’Enterria et al., Phys. Rev. Lett. 87, 22701 (2002). J. B. Elliott et al., arXiv: nucl-ex/0205004v1, 8 May 2002. J. B. Elliott et al., Phys. Rev. Lett. 88, 042701 (2002). M. Kleine Berkenbusch et al., Phys. Rev. Lett. 88, 022701 (2002). Critical Temperatures
Ideal Gas Behavior Assumed In Fisher Model Occurs Only at High Temperature and Low Density Fisher Scaling is Seen at All Densities TC Increases With Density For Small Systems Locus of Critical Behavior ( Kertesz Line) Extends Into Co- Existence Region
Limiting and Critical Temperatures Nucleonic Matter and Nuclear Matter Nuclear Matter TC Nucleonic Matter TC Limiting Temperatures
A= 36 - Maximal Fluctuations – Caloric Curve – Critical Point ? Maximal Fluctuations Y.G. Ma et al., The NIMROD Collaboration Submitted To PRL , 2003
A= 36 - Indicators of Maximal Fluctuations – Phase Change ? Y.G. Ma et al., The NIMROD Collaboration Submitted To PRL , 2003
Collisional Heating in Intermediate Energy Heavy Ion Collisions R. Wada et al Phys. Rev. C 62 034601-1 (2000)
AMD Calculation Time Evolution of Campi Plot 47A MeV 64Zn + 92Mo Y.G. Ma, R.Wada, et al., To Be Submitted July 2003 90 fm/c 100 fm/c 110 fm/c 120 fm/c 130 fm/c 140 fm/c
Phase 1 Phase 2 GOAL Study Phase 1 • Equation of State? • Excitation ? • Temperatures ? • Thermal and Chemical Equilibrium ? • Evolution of Sizes ? • Disassembly and Phase Changes ? TIME 3 X 10-22 sec. ~ 100 fm/c
NIMRODNeutron- Charged Particle Correlation64Zn + 92Mo 35A MeV 47A MeV
Light Particle Analyses CsI Fast-Slow Proton AngularDist Si Back-CsI Alpha Angular Dist.
4He -CsI Detectors Neutrons-DEMON Detectors Source Fits (and Velocity Plots) are Used to Test for Origin of Ejectiles
“Central Collision” Phase 1 Phase 2
Reactions *35A MeV 64Zn + 92Mo At End of Phase 1 A ~ 100 Ex ~ 500 MeV **47A MeV64Zn + 92Mo *40A MeV 40Ar + 112Sn *55A MeV 27Al + 124Sn * Most Violent “Central” **Less Violent “Mid-Central” A “Ghoshal Experiment” S.N. Ghoshal, Phys. Rev. 80, 939 (1950)
MASS BALANCE Composite Nucleus Masses of A ~ 100
ENERGY BALANCE Composite Nucleus Excitation Energies of ~ 5 MeV/u
CoalescenceModel 1 A-1 – 1 1 1 _____ = A.Z. Mekjian, Phys. Rev. C 17, 1051 (1978); Phys. Rev. Lett. 38 640 (1977); Phys. Lett B 89,177 ( 1980)
Double Isotope Temperatures Binding Energy Differences 14.3 THHe = 1.59 [ Yd ] [ Y4He ] ln [ Yt ] [ Y3He ] Mass and Spin Factors
Velocity Dependence of Y(t)/Y(3He), Radius and Temperature Evaporation or Disassembly Pre-Equilibrium Equilibration ?
Hot Fermi Gas A = 2 APROJ A ~100 Limiting Temperature
40A MeV 40Ar + 112Sn PRELIMINARY
Conclusions A Ghoshal-like study of the early time evolution of particle and small cluster emission in Fermi Energy heavy ion collisions indicates that a thermally and chemically equilibrated composite systems with A~100 and Ex ~ 5 meV/u have been produced in four different reactions at projectile energies ranging from 35 to 55 MeV/u. The early temperature variation appears consistent with formation of an initial hot zone containing ~ 2Ap nucleons. Projectile energy dependent times of 86 -123 fm/c have been derived for equilibration of this zone. The temperature then drops rapidly as thermal relaxation occurs and the systems expand. About 25 fm/c after equilibration of the initial zone the evaporation cascade or disassembly begins. The temperature at that time is ~ 6 MeV.
“Wash, DC: Women March Against Poverty, Denounce IMF” “Hundreds Arrested at IMF Protests” “GLOBAL DEFORESTATION HASTENED BY IMF PROJECTS” “Slammed by antiglobalist protesters, developing-country politicians, and Nobel Prize–winning economists, the IMF has become Global Scapegoat Number One.” “Special report: What is the IMF and what does it do? What makes the IMF unpopular? Who is affected? What is it thinking? Does it work? ” “ IMF not ready to bow out”