Download

1 / 27
270 likes | 377 Views
Welcome to Homeroom Please find a seat in a student desk where you will be focused. Welcome to Common Core Math III Please find a seat in a student desk where you will learn. About this course: Introduction Letter Course and pre-requisites Teacher Grades Bathroom Procedures

E N D
Welcome to Homeroom Please find a seat in a student desk where you will be focused.
Welcome to Common Core Math III Please find a seat in a student desk where you will learn.
About this course: • Introduction Letter • Course and pre-requisites • Teacher • Grades • Bathroom Procedures • Integrity • MGS/Tutorial • Electronics/Drinks Policy • Supplies • Notebook, paper, pencil, TI-84+ • Donations of soft tissues and dry erase markers would be greatly appreciated
Website: http://teachersites.schoolworld.com/webpages/SChildrey/
Warm-ups! Each day we will complete a warm-up. This is the warm-up structure: Draw this out on your own paper or print it from the website each week.
Warm-up: 1. At the doctor’s office, there are three children in the waiting room. The children are ages 3, 4, and 5. Another 4 year old child enters the room. What will happen to the mean of the children’s ages when the new child enters? When the new child enters, nothing will happen to the mean because the child’s age is the mean of the set. b) What will happen to the standard deviation of the children’s ages? The standard deviation will decrease because the 4th value is exactly equal to the mean, which will give the data less variability than originally
2. Which of the following data sets will have the largest standard deviation? Which will have the smallest standard deviation? • A. 3, 6, 9, 12, 15 • B. 5, 7, 9, 11, 13 • C. 1, 5, 9, 13, 17 • Set C will have the largest standard deviation because the values have the largest spread. • Set B will have the smallest standard deviation because the values are closest to the mean, which is 9 for all sets.
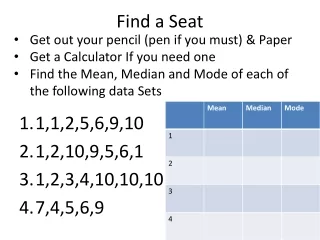
How do you find the mean? Add numbers together then divide by the number of entries What is standard deviation? How much variation from the average exists.
Three main topics in Math III Unit 1: Normal Distributions Sampling and Study Design Estimating Population Parameters
Objective: To fit a data set to the normal distribution using the mean and standard deviation AND To apply the Empirical Rule to estimate probabilities for normal distributions
Characteristics of a normal distribution: NORMAL DISTRIBUTIONS: 1. Continuous random variable 2. Symmetric with respect to the mean 3. mean = median = mode 4. Area under the curve is 1 YOUshould know these characteristics!
The Standard Normal Curve… µ = 0; σ = 1 Z-score: number of standard deviations a value is from the mean on the standard normal curve
What is the meaning of a positive z-score? What about a negative z-score?
How do you use this? The mean score on the SAT is 1500, with a standard deviation of 240. The ACT, a different college entrance examination, has a mean score of 21 with a standard deviation of 6. If Bobby scored 1740 on the SAT and Kathy scored 30 on the ACT, who scored higher?
Kathy Bobby z = 1 z = 1.5 What should a complete answer look like? • Correct mathematical work • Interpretation of that work in context of the problem
For example: Kathy scored higher than Bobby overall – her z-score on the ACT shows that she scored 1.5 standard deviations above the mean while Bobby scored only 1 standard deviation above the mean on the SAT.
The Empirical Rule: 68% of the data falls within ± 1σ
How do you use this? The scores on the Math III midterm were normally distributed. The mean is 82 with a standard deviation of 5. Find the probability that a randomly selected person: a. scored between 77 and 87 b. scored between 82 and 87 c. scored between 72 and 87 d. scored higher than 92 e. scored less than 77
Draw the curve, add the mean, then add the standard deviations above and below the mean… 67 72 77 82 87 92 97
a. scored between 77 and 87 68% b. scored between 82 and 87 34% c. scored between 72 and 87 81.5% d. scored higher than 92 2.5% e. scored less than 77 16%
Classwork: Math III U1 Days 1 and 2 problems 1, 3, and 5 only
Homework: U1D1 HW Using the Empirical Rule WS AND have your parent read the class letter online then sign & return the actual CCM III acknowledgement sheet for me.