Download
1 / 20
200 likes | 214 Views
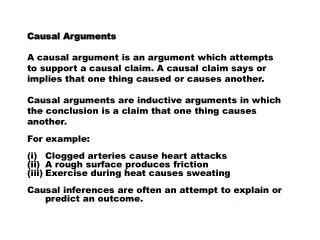
Learn about simple causal graphs, proper analysis techniques, and causal inference in H.S.'s enlightening presentation. Discover how to identify and analyze different types of variables using directed acyclic graphs (DAGs) and linear models. Uncover the impact of confounders, intermediates, and colliders on causal relationships, and make informed model choices. Dive into examples exploring exposure-disease relationships and the effects of modifiers like sex. Explore practical applications, such as determining bias direction and the importance of adjusting for certain variables. Enhance your understanding of causal inference with clear explanations and insightful examples.

E N D
Simple Causal Graphs Simple Casual Graphs Hein Stigum Presentation, data and programs at: http://folk.uio.no/heins/ H.S.
Causal graphs • Simple causal graphs • Proper analysis (adjust or not) • Direction of bias • Directed Acyclic Graphs (DAGs) • Formal tool • Inventory of variables • Proper analysis (adjust or not) • Causal inference H.S.
E D Exposure-Disease influenced by C • C can be: • Confounder • Intermediate (in 2. Path) • Collider • Effect modifier • Use graphs • Determine C-type • Choose analysis C H.S.
Example • Exposure • Pysical Activity: PA • Disease • Diabetes type 2: D2 • Covariates • Smoking: S • Health Conscious: HC • Overweight: Ov • Blood Pressure: BP H.S.
Linear models 0 • Best model? • Likelihood ratio tests or Akaike criteria mod 4 • All changes in PA effect considered important mod 4 • Claim mod 2. • Model choice can not be based on data only. • Need extra info or assumptions. H.S.
C E D C E D C E D No influence of C H.S.
- + biased true Confounder: Smoking • Should adjust for Smoking • Stratify • Regression S Negative bias PA D2 -3 -2 0 H.S.
- + + biased true Confounder 2 Adjust for Smoking or for Health Consciousness Assume all following models are adjusted for smoking HC S Negative bias PA D2 -3 -2 0 H.S.
- + Intermediate (in 2. path): Overweight Ov Alt 1: Ignore Overweight Total -2.0 PA D2 • Alt 2: Two models: • Direct c2 -1.5 • Indirect b1*c1 -0.5 • Total c2+ b1*c1 -2.0 Ov Ov c1 b1 c2 PA PA D2 Simply adjusting for Overweight is not OK! H.S.
Select limping subjects Limp + + Hip arthritis Knee injury - Collider idea Two causes for limping • Conditioning on a collider induces an association between the causes • Condition = (restrict, stratify, adjust) • Bias direction? Limp + + Hip arthritis Knee injury H.S.
- + biased true Collider: Blood Pressure • Should not adjust for Blood Pressure • Problem if selection is connected to BP BP Positive bias if we adjust PA D2 0 H.S.
Best model (so far) • Model 2 is best • Used extra info in graphs to decide H.S.
Alt 2: Model with interaction Technical Test for interaction Efficient (7 estimates) Effect modifier: Sex Sex • Alt 3 : Ignore Sex PA D2 • Alt 1 : Two models • Easy • No test for interaction • Inefficient (12 estimates) H.S.
Effect modifier: SexModel with interaction term • Test for interaction • Wald test on b3=0 • If significant interaction • Sex is coded 0 for Males and 1 for Females • The effect of PA (1 unit increase) • Linear model -2.5 -1.5 H.S.
Examples H.S.
S Educ - - Smoke LRTI Smoking and LRTIThe truth is out there? LRTI=Lower Resperatory Tract Infections Want: effect of smoking in pregnancyon LRTIin children Have: 40% response, high education is overrepresented Best causal estimate: Crude smoke-LRTI under 100% response? Crude smoke-LRTI under 40% response? Education is a confounder Selection represents partial adjustment H.S.
S Educ Smoke LRTI Smoking and LRTI, ex 2 • Education is a not a confounder • Crude smoke-LRTI in population is unbiased • Crude smoke-LRTI in sample is biased, S is a collider • Adjusted smoke-LRTI in sample is unbiased H.S.
Ethnic Height Hemo Lung func Ethnicity and lung function • Exposure Ethnic group • Outcome Lung function • Covariates Hemoglobin, height • Draw DAG • Suggest analyzes/models • Model with all covariates meaningful? H.S.
Model 1 Model 2 Height Ethnic Lung func Hemo Lung func Model 4 Model 3 Height Ethnic Height Hemo Lung func Hemo Lung func Hart rate Ethnic Models H.S.
Summing up • In a study of 2 variables, a 3. variable may have 4 effects: Confounder, Intermediate, Collider, Effect modifier • Not distinguished from data, need extra info • Casual graphs help use the extra info H.S.