Download

1 / 10
120 likes | 161 Views
Explore Riemann Sums in AP Calculus to find area under curve from x=0 to x=35 through various approximation methods. Practice Left-hand, Right-hand, and Midpoint Rectangular Approximations for better accuracy. 8 Relevant

E N D
Riemann Sums AP Calculus Ms. Battaglia
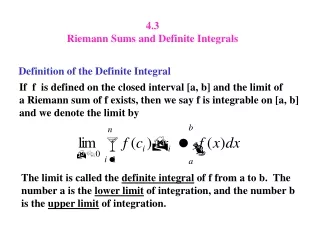
Find the area under the curve from x = 0 to x = 35. The graph of g consists of two straight lines and a semicircle.
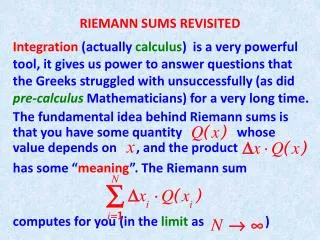
velocity time Consider an object moving at a constant rate of 3 ft/sec. Since rate . time = distance: If we draw a graph of the velocity, the distance that the object travels is equal to the area under the line. After 4 seconds, the object has gone 12 feet.
Approximate area: If the velocity is not constant, we might guess that the distance traveled is still equal to the area under the curve. (The units work out.) Example: We could estimate the area under the curve by drawing rectangles touching at their left corners. This is called the Left-hand Rectangular Approximation Method (LRAM).
Approximate area: We could also use a Right-hand Rectangular Approximation Method (RRAM).
Approximate area: Another approach would be to use rectangles that touch at the midpoint. This is the Midpoint Rectangular Approximation Method (MRAM). In this example there are four subintervals. As the number of subintervals increases, so does the accuracy.
Approximate area: The exact answer for this problem is . With 8 subintervals: width of subinterval
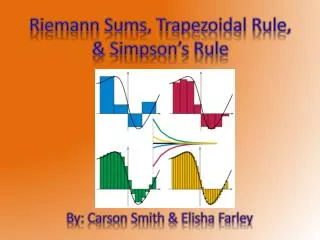
Circumscribed rectangles are all above the curve: Inscribed rectangles are all below the curve:
Example • Use left and right endpoints and 4 rectangles to find two approximations of the area of the region between the graph of the function and the x-axis over the given interval.
Homework • LRAM, RRAM, MRAM Worksheet