Download
1 / 30
310 likes | 686 Views
Inventory Planning, Control & Valuation. What is an Inventory ?. Inventory the stock of any item or resource used in an organization: raw materials, finished products, component parts, supplies and work-in-process. An inventory system policies and controls for monitoring levels of inventory

E N D
What is an Inventory ? Inventory • the stock of any item or resource used in an organization: raw materials, finished products, component parts, supplies and work-in-process. An inventory system • policies and controls for monitoring levels of inventory • Information system that records transactions and enables analysis of stock requirements and levels/quantities, costs etc
Why hold inventory / stock? • Provide flexibility • minimum delay in supplying customers • a good range • Protect against uncertainties • Enable economic purchasing • Anticipate changes in demand or supply • Buffers to feed processes and enable efficient scheduling • Strategic stock holdings
Inventory Types • Raw-materials. • Work-in-progress or in-transit • Finished-goods • In the warehouse, awaiting shipment, in delivery vehicles, in tanks, on shelves, in the stores • Strategic inventory • Scrap & re-work
The Nature of Inventory Planning • Inventory do not give revenues without operations. • Organizations resources are limited there for investments in inventory should be optimized ( Economic ). • Why to manage inventory ? To ensure a continues operation activities (non-stop).
Costs of Inventory • Ordering costs • Offering prices,purchase order & office, shipping and/or set up • Holding / Carrying Costs • tied up capital (item value), staff & equipment, obsolescence, perish ability, shrinkage, insurance & security, (rent/lease), audit, taxes. • Cost of being out of stock, cancelling an order • Scrap and re-working • Shortage Costs .
Inventory Costs • Item cost • Carrying costs • Capital costs • Storage costs • Risk costs • Obsolescence • Damage • Pilferage • Deterioration
Inventory Costs (cont) • Ordering costs • Production control costs • Setup and teardown costs • Lost capacity costs • Purchase order costs • Stockout costs • Capacity-associated costs
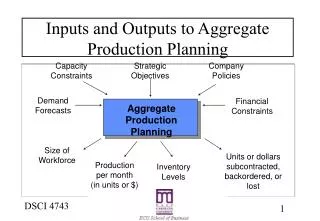
Material-Flows Process Production Processes Work in process To Customer Stores warehouse Finished goods WIP From Suppliers WIP Inventory in transit
Stock : Input (Flow in), Storage (Holding) and Flow out (Usage) Inventory Level Supply Rate Stock Level Rate of Demand (Usage)
Economic Order Quantity (EOQ) • In trying to minimize inventory costs a company must find the order quantity which spreads the ordering or set-up costs over as many units as possible without incurring excess holding costs. • The EOQ model attempts to determine the amount of units to purchase which will minimize the total costs associated with ordering and holding inventory
Economic Order Quantity (EOQ) • How to calculate EOQ ? • Tabular Approach /Trial and Error. (waste time) • Graphic Approach /By using charts. • Formula Approach /Mathematically .
Total Cost Holding Costs Ordering Costs Qeoq Order Quantity (Q) EOQ Aim = Cost Minimization Holding + Ordering costs = total cost curve. Find Qeoq inventory order point to minimize total costs. Cost
Economic Order Quantity (EOQ) • EOQ Assumptions • Demand is known and constant. • Lead time is known and constant. • Order and holding costs are averaged across all transactions. • Single product line • No quantity discounts - stable unit cost • No stock-outs allowed • Items ordered/produced in a lot or batch • Batch received all at once • Holding cost is linear based on average stock level • Fixed order + set up cost
Calculate EOQ 2DS 2(Annual/Period Demand) (Order cost) Qeoq = = H Holding Cost (total unit cost * %storage) = Exercise EOQ and reorder point? • Annual demand = 12,000 units • Days/year in average daily demand = 365 • Cost to place an order = £500 • Holding cost /unit p.a. = £12 ( 20% Cost per unit) • Lead time = 7 days • Cost per unit = £60
EOQ Solution 2DS 2(12,000 )(500) Q = = = 1000 units eoq H 0.2 * 60 Number of orders = Annual Demand / EOQ = 12000 / 1000 = 12 orders per year. Orders Cost = 12 * 500 = 6000 £ Total Holding Cost = 0.2*60*1000 2 = 6000. £ There for Total Inventory Cost = 6000 + 6000 = 12000 £
EOQ Table – minimum TVc Avg.stock x item £ x hc % Oc + Hc
Cost Estimation & Model Sensitivity • In practical way it’s difficult to estimate the variables in the EOQ model such as the holding cost. • Example: Not that much in sensitivity
Extensions of the EOQ model 1. EOQ with Order Size Restrictions . 2. EOQ with Storage limitations . 3. EOQ with quantity discount .
Extensions of the EOQ model 1. EOQ with Order Size Restrictions . Example: AICO ltd Demand Expected next year : 5000 units. Supplier packages only contains 400 unit for each. EOQ = 1000 unit when ordering cost 10$ & holding cost per unit 0.1$ We have two options : 800 unit or 1200 unit .
Extensions of the EOQ model 2. EOQ with Storage limitations . Example: AICO ltd Demand Expected next year : 5000 units. Supplier packages only contains 400 unit for each. EOQ = 1000 unit when ordering cost 10$ & holding cost per unit 0.1$
Extensions of the EOQ model 3. EOQ with quantity discount .
The Reorder Point (ROP) when to place an order in units? Reorder point ROP = D * L D = Avg daily demand (constant) L = Lead time (constant) Annual Demand = 10,000 units Days per year considered in average daily demand = 365 Cost to place an order = £10 Holding cost per unit per year = 10% of cost per unit Lead time = 10 days Cost per unit = £15
10,000 units/year D = = 27.397 units/day 365 days EOQ and ROP example 2DS 2(10,000)(10) = 365.148 (366 units) Q = = H 1.50 eoq If lead time = 10 days, Reorder point = 27.39 * 10 days = 273.97 = 274 units Place order for 366 units. When 274 left, place next order for 366.
Order Quantities & Reorder Points Average stock q/2 No. of units on hand q q safety or buffer level R L L Time R = Reorder point L = Lead time
A . O r d e r q u a n t i t y o f 4 0 0 u n i t s I n v e n t o r y O r d e r O r d e r a r r i v a l a r r i v a l 4 0 0 O r d e r O r d e r A v e r a g e p l a c e d p l a c e d c y c l e i n v e n t o r y 2 0 0 0 1 0 2 0 3 0 4 0 5 0 6 0 D a y s Order Quantities & Reorder Points
Safety Stock and Re-order Levels • Reserve - buffer - cushion against uncertain demand (usage) & lead time. • A basis for a "2-bin" system • Application to JIT? EOQ assumes certain demand & lead time. If uncertain, then: ROL = Average usage in lead time + safety stock (Avg. lead time x Avg. daily usage)
How Much Safety Stock? Cost vs. safety level Depends on: • Uncertainty: demand & lead time • cost of • being out of stock • carrying inventory • increasingly better service • Service level policy • % confidence of not hitting a stock-out situation
2200 2000 Actual lead time is 3 days! (at day 21) Dip into safety stock Order Point Units 400 200 Safety Stock 0 18 21 Days Order Point with Safety Stock