Download
1 / 15
150 likes | 170 Views
Explore the evolution of superclusters and voids in the universe from early studies to current discoveries. Learn about the role of dark matter and the complexity of large-scale structures. Delve into research findings and comparisons with simulation data.

E N D
Superclusters-Void Network Jaan Einastoand Enn Saar Tartu Observatory Bernard60 – 27.06.2006
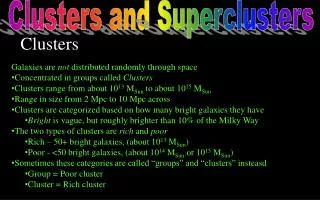
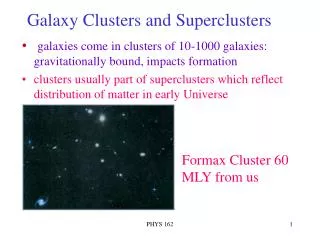
Early studies (1970 – 1980) • Dark matter is dynamically dominating in the Universe (1974) • Zeldovich question (1974) • Structures evolve slowly – present structure close to initial • Search for structures using 1st complete redshift surveys • Virgo & Perseus superclusters – chains of galaxies, clusters, groups & voids
Density evolution in over- and under-dense regions: In over-density regions density increases until collapses to form galaxies, clusters (pancaking); In under-density regions density decreases and matter remains in primordial form (DM + rarefied baryonic matter) Conclusion: galaxies & clusters form along chains in superclusters, in low-density regions (voids) matter remains in primordial non-clustered form – first evidence for physical biasing (1980)
Tallinn conferences 1977: Large-Scale Structure of the Universe 1981: The Nature of Dark Matter Jim Peebles & Scott Tremaine 1977 Yakov Zeldovich & his wife, 1980 Zeldovich (speech on Tallinn conferencebanquet 1981): Observers work hard in sleepless nights to collectdata; theorist interpret observations, are often in error, correct their errors and try again; and there are only very rare moments of clarification. Today it is one of such rare moments when we have a holy feeling of understanding secrets of the Nature. Non-baryonic dark matter is needed to start structure formation early enough.
Supercluster-void network: 2dFGRS data 2dFGRS Northern and Southern regions contain superclusters of various richness and voids
Supercluster-void network: SDSS DR4 3 wedges ~10 deg wide in the DR4 high-declination zone
Structure of supercluster SCL126 (Sloan Great Wall) Above: density field smoothed with 1& 8 Mpc/h kerner, 1 Mpc/h thick Below: density field smoothed with 1 Mpc/h kernel, ~ 10 Mpc/h thick
Supercluster catalogues 2dFGRS and SDSS DR4 have been used to find superclusters as high-density regions smoothed with Epanechnikov kernel of radius 8 Mpc/h. Luminosity density field has been corrected to take statistically into account galaxies and groups outside the observational window of the flux-limited galaxy catalogue 2dFGRS – 544 superclusters SDSS DR4 – 911 ” For comparison we used Millennium Simulation mock galaxy catalogue and found Mill.A8 - 1733 superclusters (full sample) Mill.F8 - 1068 ” (simulated 2dF sample)
Comparison of superclusters with models The distribution of maximal, minimal and effective diameters of superclusters. Left top: 2dF superclusters Right top: Millennium superclusters Right bottom: SDSS superclusters
Luminosity and multiplicity functions of superclusters Left: relative luminosity functions of superclusters (luminosity of poor superclusters is taken as unit) Right: multiplicity functions of superclusters Note the difference between real and simulated superclusters: luminosities and multiplicities of most luminous real superclusters exceed those of simulated superclusters about 5 – 8 times
Illustration of the difference of supercluster richness: left – DM model M500; right – 2dFGRS North Real Universe has more very rich supeclusters than predicted by current models.
Wavelet decomposition of the SDSS Density Field We use Data Release 3 of Sloan Digital Sky Survey. Density field is calculated for Northern equatorial slice 2.5° thick, over 100° wide. Total expected luminosity is estimated assuming Schechter luminosity function. Density field is smoothed using Gaussian kernel of size 0.8 Mpc. To see the role of waves of different scale we use the ‘a trous wavelet transform. The field is decomposed into several frequency bands, each band contains frequencies twice the previous band. The sum of these bands restores the original field.
Characteristic scale 512 256 128 64 32 Original
Results of the wavelet analysis • Superclusters form in regions where large density waves combine in similar high-density phases • Superclusters are the richer the larger is the wavelength of phase synchronization • Voids form in regions where large density waves combine in similar low-density phases
Conclusions • Structure of superclusters is very well explained by current models • But: there are more very rich superclusters than models predict • Large perturbations evolve very slowly and represent the fluctuation field at the epoch of inflation • The difference between observations and models can be explained in two ways: • Large-scale perturbations are not incorporated in models, i.e. Models need improvement • There were presently unknown processes during the inflation epoch