Download

1 / 19
190 likes | 353 Views
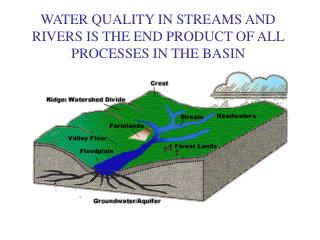
Water Quality of Mullins Creek/ Determined by Aquatic Diversity. Josh Thomasson Biology-Environmental Concentration Tennessee Techological University Cookeville, TN 38506. Introduction.

E N D
Water Quality of Mullins Creek/ Determined by Aquatic Diversity Josh Thomasson Biology-Environmental Concentration Tennessee Techological University Cookeville, TN 38506
Introduction • The study of macroinvertebrates being used to determine water quality has been used since the early 1900’s. Since it has been found that these macroinvertebrates are a very useful way to detect even the slightest amount of pollutants, they have been used extensively to test water quality (Cairns & Pratt 1993).
Objective What I wanted to do was to see what kind of effect the Tennessee River had on the quality of this stream, using macroinvertebrates to determine this.
Hypothesis • What I expected to find was that the Tennessee River had an exact correlation to the water quality present in Mullins Creek. I assumed that the river would definitely have a negative impact.
How can I test this? • To test my hypothesis I needed to set up an experiment that would let me use the macroinvertebrates in the stream to test the water quality. • I also needed something to compare my results to.
What could I use to compare my data to? • Well I used a study that the Tennessee Department of Environment and Conservation had done on Ellis Gab Branch, which is approximately 7km from my stream. • This study was done in 2003 and they used both the EPT% and the NBCI method to determine results.
What is EPT% and NCBI? • EPT% is found by the percentage of (Ephemeroptera, Plecoptera, and Trichoptera) these are three orders of invertebrates that are found to be good indicators of water quality because they breathe using gills. To find this percentage you simply take the total number of individuals found in these three orders and divide that by the total number of individuals in the sample. The percentage you get is the EPT%.
NCBI cont. • NCBI stands for the North Carolina Biotic Index. • This method has a set value for every genus found in Tennessee. • To find this you simply multiply the value of each genus by the number of individuals that were collected in that genus and add all of them up.
Methods and Materials • To do my sampling I used a D-framed net (left) and a kick sein (right). To use both of these you hold them down stream away from your body and begin to walk towards it kicking and disrupting the substrate.
Methods and Materials cont. • Once the sample is complete you take everything that was collected and put in a 70% isopropyl alcohol solution and bring back to be identified.
Methods and Materials cont. • Once all of my identification was complete, I began to interpret my data. • Left Gomphus sp. • Right Corydalus sp.
Results • I found that upstream had an EPT% of 73.8% which is somewhat lower than I had anticipated but not abnormally low. • At the River I found the EPT % to be drastically lower at 37.5%. • And an overall EPT% of 60.2%. This was lower than I expected, but it compares very well to the Ellis Gap Branch study which showed to have an EPT% of >60.2%.
Results cont. • NCBI values • I found the up stream site to have an NCBI value of 3.67, this is pretty good considering that 0-3 is considered a healthy stream and 4-7 is moderately healthy. • At the river I found the value to be slightly higher at 4.37, so this still shows moderately healthy stream quality. • Ellis Gap Branch NCBI value <4.58.
Conclusions • Even though the EPT% was very different in the two locations the NCBI values were relatively close, and it is a more sensitive and accurate measure. And my numbers match up almost precisely with what the State found in their study. • So even though there is a slight difference in water quality, I don’t think that there is enough to back up my hypothesis that the Tennessee River would have a drastic effect on water quality.
Conclusions Cont. • I rejected my null hypothesis, due to there not being a big enough of a change in water quality.
Acknowledgements • Dr. Brad Cook • Caleb Thomasson
Literature Cited • Cairns,J. and J.R. Pratt (1993). A history of biological mentoring using benthic macroinvertebrates. Pg. 10-27 • Merrit, R.W. and K.W. Cummings (1996) An Introduction of the Aquatic Insects of North America. 3rd ed. Dubuque, Iowa. • Pedersen, M.L. (2003) Physical Structure of Lowland Streams and Effects of Disturbance. PhD thesis National Environmental Research Institute pg 108 • Stark, J.D., I.K.G. Boothroyd, J.S. Harding, J.R. Maxted, M.R. Scarsbrook. (2001) Protocols for sampling macroinvertebrates in wadeable streams.
Questions? • Josh Thomasson • Biology-Environmental Concentration • jdthomasso21@tntech.edu