Download

1 / 8
90 likes | 266 Views
The SIO Glider Program. The underwater glider ‘Spray’. Operations in AOSN 2003. ~2.5 km. Five gliders for 5 weeks uninterrupted Operate 5 ~100-km offshore sections Speed ~25 km/day ~0.5 knot Profile to 400 m or 3 m from bottom Cycle takes ~3 hours. ~ 400 m.

E N D
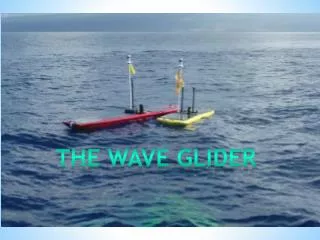
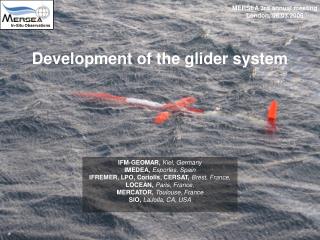
The SIO Glider Program The underwater glider ‘Spray’
Operations in AOSN 2003 ~2.5 km Five gliders for 5 weeks uninterrupted Operate 5 ~100-km offshore sections Speed ~25 km/day ~0.5 knot Profile to 400 m or 3 m from bottom Cycle takes ~3 hours ~ 400 m Objectives: data for model assimilation; technical development 0 to 400 m vertical average velocity interesting T data good but need higher vertical resolution CTD, Optical Backscatter, Fluorometer all suffer from biofouling Scales are 25 km and 2 days, shorter than we planned for
August 2003 Glider Array 0-200m 0-400m
Fouling Is The Limit to Duration In AOSN II five Sprays operated 35 days using 20% of their battery energy All five optical (backscatter/fluorometer) sensors failed from fouling CTDs were erratic as a result of biofouling Even if sensors work, fouling will eventually degrade gliding performance
Scales of Variability Scales longer at surface – Offshore variation unknown On average L ~ 25 km T ~ 2 days T L
MURI 2005 Preparations Test new CTD and short-range ADCP in San Diego Improve and simplify the AOSN 2004 quality-control process and provide web access Develop web-based software to simplify control and to guard against errors in issuing mission changes 2005 Field Trial: Verify that bio-fouling problems under control Gather statistical info (scales, tide energy, etc.) needed to plan 2006 experiment. Use adaptive control to control scale-measuring array
MURI 2006 4 Sprays with CTD and ADCP (U(z), T(z), S(z)) Use software for 24/7 maintenance of the array to maximize mapping skill will be available (in collaboration with Princeton) Gliders can be used to map mesoscale while investigating: 1. Mixing (Thorpe Scale) and relation to Richardson Number 2. Mixing and advection by internal tides 3. Mixed layer response to winds in upwelling 4. Accuracy of acoustic propagation predictions?