Download
1 / 24
240 likes | 329 Views
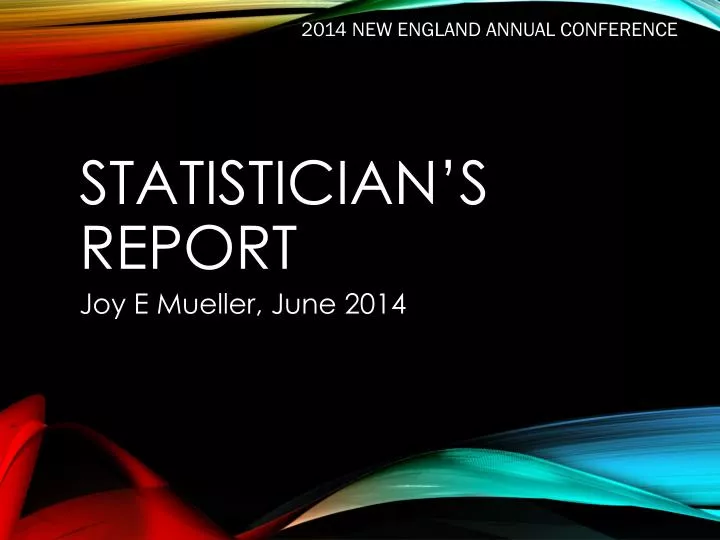
2014 NEW ENGLAND ANNUAL CONFERENCE. STATISTICIAN’S Report. Joy E Mueller, June 2014. Membership:. Professions of Faith:. baptisms:. Children enrolled:. Worship attendance:. Churches Increasing Worship Attendance. 153 churches have increased worship attendance from 2012 to 2013

E N D
2014 NEW ENGLAND ANNUAL CONFERENCE STATISTICIAN’S Report Joy E Mueller, June 2014
Churches Increasing Worship Attendance • 153 churches have increased worship attendance from 2012 to 2013 • 121churches have increased worship attendance from 2008 to 2013 • 97 churches have increased worship attendance from 1994 to 2013
Mission Share calculationIncludes: Pastors’ Compensation & Benefits Lay Employees Compensation & Benefits Program Expenses Operating Expenses
Mission Share calculationDOES NOT Include: Mission Spending Capital Expenses Loan Payments Endowment or Other Assets Giving Statistics People counted as Worshippers or Members
Step 1: Mission Share calculation + Pastors’ Compensation & Benefits + Lay Employees Compensation & Benefits + Program Expenses + Operating Expenses DEDUCTION for Outside Group Use (Chart A) = MISSION SHARE BASE for Year
STEP 2: Mission share calculation Each church’s FACTOR is calculated by dividing the church’s MISSION SHARE BASE by the total of all churches’ mission share bases FACTOR = Church’s MISSION SHARE BASE SUM of MISSION SHARE BASE for all Churches
STEP 3: Mission share calculation The church’s factors are averaged for the three most recent years when data is available. For 2013, statistics for the years 2009, 2010, and 2011 were used: Average Factor = (2009 Factor + 2010 Factor + 2011 Factor) 3
STEP 4: Mission share calculation The Average Factor is multiplied by the dollars to be apportioned from the conference budget Mission Shares = Average Factor$ Needed for conference budget
Mission Shares 2013 $7.5 Million Dollars Apportioned to Local Churches Minimum: $106 Maximum: $86,880 Median: $8,424
Mission Share statistic: 2013 On average, For each $1 spent in one of the spending categories, 17 cents was apportioned in mission shares
Mission shares: 15 of the 55 churches who paid $0 in 2013, also paid $0 in each year from 2009 to 2013 – this represents less than 3% of all churches
Mission shares: 70 of the 176 churches who paid 50% or less in 2013, also paid 50% or less in each year from 2009 to 2013 – this represents11% of all churches
Mission shares: 6 churches who paid less than 50% for the years 2009 - 2012, paid 100% in 2013
Scatter Plot for 616 cHURCHES: Professions of faith by membership
Strong, Maine Franklin County Population: 1213
Strong UMC Mid-Maine District Membership 2012: 81 New Members 2013: 33 Baptisms 2013: 20
Strong UMC’s Story Reaching out to the community: VBS Inviting Families to come to church Responding by making changes Growing together in ministry and mission