Download
1 / 34
350 likes | 465 Views
Measuring the price of security of supply. Andy Philpott The University of Auckland www.esc.auckland.ac.nz/epoc (joint work with Kailin Lee, Golbon Zakeri). From: Electricity Commission Reserve Energy Review, p44, November 2007. From Electricity Commission Presentation, October 2007.

E N D
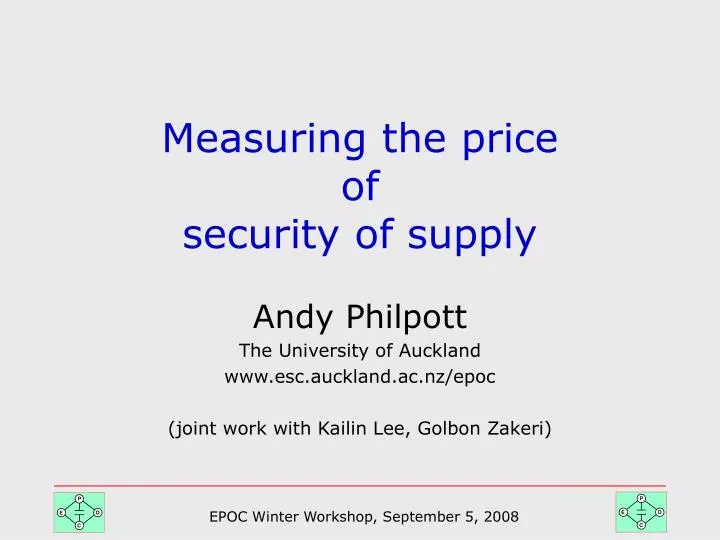
Measuring the price of security of supply Andy Philpott The University of Auckland www.esc.auckland.ac.nz/epoc (joint work with Kailin Lee, Golbon Zakeri)
From: Electricity Commission Reserve Energy Review, p44, November 2007.
Motivation • Minzone and energy margin • How much energy margin to hold for possible dry winters • Castalia Review of Security • Electricity Commission Reserve Energy Review (Nov 2007) • Energy margin depends on generators’ policies • Computational models for minimum expected cost • Stage and Larsson • RESOP (Read) • SDDP (Pereira) = DOASA (Guan,Philpott) • How should we compute energy margin? • How good is DOASA versus Stage and Larsson?
S. Stage, Y. Larsson AIEE Transactions (Power Apparatus and Systems) August, 1961
Marginal water value at the state obtained by optimally releasing starting at state s and obtaining inflow i followed by j
π(100)=0 π(50) π(m)=T Marginal water value is the average of endpoint marginal values of simulated trajectories π(70)
Test 1 versus SDP Single reservoir with capacity 100MWh Three thermal plants each capacity 3MW, cost $45, $50, $100/MWh One hydro plant capacity 3 MW Demand is 8MW peak, 5 MW offpeak Inflows are 1..8 MWh each with Pr=0.1 Inflow of 0 with Pr 0.2 52 peak hours and 52 offpeak hours
Test 2: SL versus DOASA (SDDP) • 70 Historical inflow sequences (1934-2004) • Use 2005/2006 demand and cogeneration data • Geothermal capacity offered at zero cost • Wind capacities set at expected generation and zero cost • Thermal plant capacities and costs as in DOASA • 2005/2006 Minzone used (June 2005-May 2006) • DOASA assumes 10 (stagewise independent) random openings from 1995-2004. • Initial Marginal Water Value (SL)= 0
HAW MAN TPO DOASA system demand N S demand
Lower bound after 200 cuts Takes about 8 hours on a standard Windows PC to converge Upper Bound
2005-2006 GWh storage simulated with historical inflow sequences
Stage and Larsson SL Policy computed using same parameters as DOASA Cuts for SL recorded with slope b and intercept a. Policy represented in DOASA by adding cuts of the form ri parameters convert m3 to GWh for reservoir I
Thermal generation (MWh) SL: 4159 GWh DOASA: 3741 GWh
2000 cost comparison DOASA Thermal Fuel cost = $141 M Stage-Larsson Thermal Fuel cost = $157 M
2001 cost comparison DOASA Thermal Fuel cost = $207 M Stage-Larsson Thermal Fuel cost = $297 M
So what? • Energy margin depends on generators’ policies • Analysis so far assumes policy is to minimize expected cost via a central planning model: risk aversion might alter the energy margin required. • What if we assume oligopoly model? Could compute the margin for result of Nash equilibrium policies (e.g. using Dublin) • If we adopt a central plan model then we must be aware of differences between Stage and Larsson, RESOP, and DOASA. These will give different recommendations for reserve. • This the first comparison made between DOASA models and heuristics. DOASA is better than I expected.