Download
1 / 56
560 likes | 731 Views
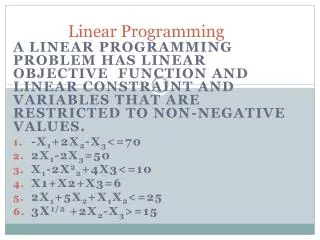
Linear Programming. Module Objectives. · Explain the importance of optimization to service operations management. · Give a real example of an operations management decision modeled with linear programming. · Demonstrate how to develop linear programming models.

E N D
Module Objectives • · Explain the importance of optimization to service operations management. • · Give a real example of an operations management decision modeled with linear programming. • · Demonstrate how to develop linear programming models. • · Show how waiting line models can be solved using EXCEL SOLVER. • · Discuss required assumptions and LP modeling complications. • · Demonstrate 0-1, transportation, and assignment models.
Concepts • OPTIMIZATION - find best possible answer • OBJECTIVE- what it is you want to accomplish • OBJECTIVE FUNCTIONmeasure of attainment of objective
History • 1930s - transportation method • WWII - Dantzig: simplex method degeneracy (computer could cycle) size limit • 1979 - Khachian: ellipsoid algorithm • 1984 - Karmarkar: Bell Labs algorithm
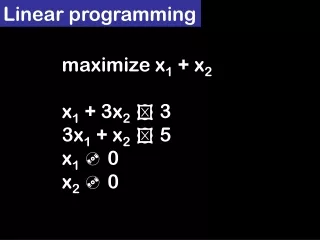
LP Model optimize {max or min} objective function (if min, maximize the negative) subject to limits (constraints) ( ) for i=1,m
Assumptions of LP • Linearity - all functions linear no diminishing returns, no economies of scale • Certainty - all coefficients ( ) are known constants no distributions • Continuity - solution liable to contain fractional values for
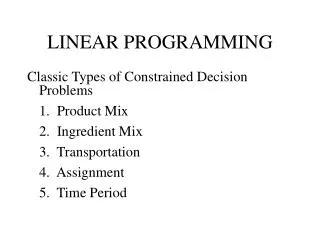
Applications • Resource allocation blending, product mix, inventory budget allocation, cash flow • Planning & scheduling • Diet • Transportation • Assignment
Production Mix Example • Decision - how many cans to produce each day • Variables – H&B, JHB, LB, JLB, JP • Objective - maximize profit • Objective function - how it is measured 0.21H&B+0.20JHB+0.10LB+0.15JLB+0.10JP • Limits – cans, ham, beans, max, min
Model Max 0.21 H&B + 0.20 JHB + 0.10 LB + 0.15 JLB + 0.10 JP s.t. 1 H&B + 1 JHB + 1 LB + 1 JLB + 1 JP 24000 4 H&B + 3 JHB 30000 9 H&B + 9 JHB + 14 LB + 12 JLB 100000 H&B 5000 H&B 10000 JHB 1000 JHB 4000 LB 1000 LB 6000 JLB 2000 JLB 4000 JP 0 JP 1000
Constraints • Can function 10,000 cans/day • Ham function 30,000 oz/day • Bean function 100,000 oz/day highly predictable, or would be uncertain
Diet Management • Decide what food to give hospitals army • CAMP - IBM system library • Finnish school menu - lowered fat, reduced cost • Newer models - incorporate preference
LP • Can optimize many business problems • Must consider the assumptions that are made • LP gives extreme solutions • if assumptions not appropriate, answer can be widely off
Sensitivity Analysis Impact of changing any parameter economic interpretation
Issues • Reduced cost - effect of change in contribution coefficients • will the optimal solution change? • Dual price (shadow price; marginal value) • economic interpretation of resource (constraint) value
Reduced Cost • Amount a nonbasic decision variable needs to be improved before it would be attractive enough to include in the optimal solution • Relates to • Nonbasic - not included in the set of m variables in simplex solution • therefore, solution value = 0
Reduced Cost Example • H&B current profit 0.21, basic (in solution) • If price increases, no change (in solution) • If price decreases 0.01, another solution better • HJB current profit 0.20, in solution but at minimum • INSUFFICIENT • Reduced cost –0.01 • Would need 0.20+0.01 >= 0.21 to make worthwhile producing more
Reduced Cost Example • Cj analysis APPLIES IF ONLY ONE CHANGE IN MODEL COEFFICIENTS • If more than one Cj changes, can apply 100% RULE • NO CHANGE IN OPTIMAL SOLUTION IF: sum of ratios D/[allowable D] over all decision variables is <= 1.0 • note D is change
100% Rule Example If all profit rates dropped by .005 D allowable D/allowable H&B: -.005 -.01 .5 JHB: -.005 -infinity 0 LB: -.005 -infinity 0 JLB: -.005 -infinity 0 JP: -.005 -0.1 .05 SO NO CHANGE .55 < 1 PROFIT would drop (still better than any other)
100% rule • A ONE-WAY test: if sum > 1.0, doesn’t prove anything if all drop .01 D allowable D/allowable H&B: -.01 -.01 1.0 JHB: -.01 -infinity 0 LB: -.01 -infinity 0 JLB: -.01 -infinity 0 JP: -.01 -0.1 .1 SO DON’T KNOW 1.1 > 1
Dual Price Analysis • DUAL PRICE: rate of change in objective function per one unit increase in right-hand-side • Range analysis: NOT FOR OPTIMALITY, but for APPLICABILITY OF DUAL PRICE • how much right-hand-side could vary before DUAL PRICE would change
Dual Price Example • ECONOMIC INTERPRETION IF Beans increased 1 unit, NEW SOLUTION: objective function increase of $0.023 per ounce/day IF Ham increased 1 unit, NO CHANGE IN OPTIMAL SOLUTION have 3444 spare units per day IF Cans increased 1 unit, NO CHANGE IN SOLUTION: have 13,111 spare cans per day
Dual Range Analysis How much RIGHT-HAND-SIDE can change before DUAL PRICE changes Cans: if drop 13112 (to 10888), starts to make a difference Ham: if drops 3444 (to 26556), starts to make a difference Beans: same 0.023 dual price unless increases 7750 (to 107,750) or drops 8000 (to 92,000) assumes ONE CHANGED parameter
Dual Range Analysis • Beans: if could acquire more beans, would be willing to pay up to 0.073 per ounce • Currently paying $0.05/ounce • Value is 0.05 + 0.023 more • Not suggesting paying more • IT WOULD BE ECONOMICALLY WORTHWHILE
Sensitivity Analysis • Can gauge the stability of the solution • ONLY CAN CONSIDER ONE CHANGED PARAMETER AT A TIME • except for 100% rule • DUAL PRICE can show impact on objective of changing right-hand-side
Integer & 0-1 Programming the assumption of continuity not appropriate in all cases models, solution methods
Types of Models • All integer • require round numbers in solution • how many trucks to buy, buildings to build • Zero-one • binary (incur cost or don’t; fund project or don’t) • Mixed • some variables continuous; others integer or 0-1
Solution Methods • Round off • Graphical • Branch & bound • Various enumeration methods
Example Max 9X + 10Y Max 10X + 22Y st 3X + 4Y <=30 st 2X + 5Y <=20 2X + Y <=12 6X + 4Y <=24 solution: X = 3.6 X = 1 9/11 Y = 4.8 Y = 3 3/11 obj = 90.18 obj = 86
Rounding Max 9X + 10Y Max 10X + 22Y st 3X + 4Y <=30 st 2X + 5Y <=20 2X + Y <=12 6X + 4Y <=24 X = 3.6 4 X = 1 9/11 2 Y = 4.8 5 Y = 3 3/11 3 obj = 90.18 86 obj = 90.18 86 but not feasible feasible, 3X + 4Y = 32 not optimal 2X + Y = 13 (X=0,Y=4,obj 88)
Graphical • Requires there be only two variables • Plot all integer values (dots) • Plot iso-objective function lines • Balance on dot with greatest objective
Branch & Bound • Systematic search • Use LP to generate optimal solutions • Impose constraints to force integrality • Need to branch whenever constrained
B&b Problem A Max 9X + 10Y X=3.6, Y=4.8, Z=90.18 st 3X + 4Y <= 30 2X + Y <= 12 BRANCH: X<=3 X>=4 X=3, Y=5.25, Z=79.5 X=4, Y=4, Z=76 not integerfeasible (LB) BRANCH: Y<=5 Y>=6 X=3, Y=5, Z=77X=2, Y=6, Z=78 *OPT
Problem A Sequence Original: two fractional variables BRANCH X<3 X>4 fractional answer integral:fathomed BRANCH Y<5 Y>5 integral infeasible fathomed OPTIMAL must fathom each branch
Enumeration Need to be able to identify all possible answers if zero-one, this is possible (a problem if n>30 [1,073,741,824]) simply take the greatest objective (a search problem)
Capital Budgeting • Decision: which investments to adopt • Have a budget • May have other constraints • scarce skills • required features • Each project is a 0-1 variable 0 - don’t fund; 1 - fund
Inventory • Order costs are do or don’t (0-1) • set-up costs the same • Holding costs are continuous • Variables for: • order for each time period (0-1) • quantity on hand (continuous) • quantity added (received), deleted (sold) • Mixed integer model
Project Selection Just like capital budgeting decision: which projects to fund (1) or not (2)
Black Fly Control Solomon, et al., Interfaces [1992] Western Africa - black flies carry disease 1974 - program to control eggs 11 day reproductive cycle sprayed from helicopter LP: min cost st sufficient dosage variables: treatments by point by time (0-1) saved $400,000 per year
Bellcore Project Selection Hoadley, et al., Interfaces [1993] research product: work needed to deliver technology 1991 - 222 products, 1046 projects projects: infrastructure benefit all usage sensitive - shared by few elective - user specific nonlinear integer program max utility index 0-1 variables for participation greater overall satisfaction
Telecommunications Net Cox, et al., Interfaces [1993] US West - 14 western states fiber-optic new, copper old,cable links need redundency least-cost expansion plans reduce cost, ensure service variables: flows between links links were 0-1 5 minute to hours to solve saved 10% over existing, $100 million
Summary • Many useful models require variables be integer or 0-1 • For integer, LP based best (branch & bound using LP to generate) • For 0-1, enumeration often better
Transportation Models problem structure solution method applications
Transportation Model • Special class of problem • set of demands with known requirements • set of sources with known supply • find the set of assignment quantities minimizing cost • Variables: quantity from each source to each demand • Constraints for each demand, supply • aij coefficients always 1
Why • A commonly encountered managerial decision • firms have multiple warehouses to serve many retailers • There is an efficient solution method • Hitchcock [1941]
Example • Refining • SOURCES: DESTINATIONS: Houston San Antonio Corpus Christi Texarkana Fort Worth El Paso
Example • VARIABLES & COSTS Hou-SA 20 CC-SA 6 FW-SA 2 Hou-Tx 9 CC-Tx 10 FW-Tx 15 Hou-EP 5 CC-EP 18 FW-EP 12 • Objective: minimize sum of variable quantities times costs
Example • CONSTRAINTS for each SUPPLY: Hou-SA + Hou-Tx + Hou-EP 150 CC-SA + CC-Tx + CC-EP 100 FW-SA + FW-Tx + FW-EP 250 for each DEMAND: Hou-SA + CC-SA + FW-SA 200 Hou-Tx + CC-Tx + FW-Tx 120 Hou-EP + CC-EP + FW-EP 180
Balance • Transportation model is BALANCED if: SUPPLY = DEMAND • If NOT Make equal by creating DUMMY source or demand (whichever is smaller)