Download
1 / 62
630 likes | 815 Views
ICS 278: Data Mining Lecture 9,10: Clustering Algorithms. Padhraic Smyth Department of Information and Computer Science University of California, Irvine. Project Progress Report. Written Progress Report: Due Tuesday May 18 th in class

E N D
ICS 278: Data MiningLecture 9,10: Clustering Algorithms Padhraic Smyth Department of Information and Computer Science University of California, Irvine Data Mining Lectures Lecture 9,10: Clustering Padhraic Smyth, UC Irvine
Project Progress Report • Written Progress Report: • Due Tuesday May 18th in class • Expect at least 3 pages (should be typed not handwritten) • Hand in written document in class on Tuesday May 18th • 1 Powerpoint slide: • 1 slide that describes your project • Should contain: • Your name (top right corner) • Clear description of the main task • Some visual graphic of data relevant to your task • 1 bullet or 2 on what methods you plan to use • Preliminary results or results of exploratory data analysis • Make it graphical (use text sparingly) • Submit by 12 noon Monday May 17th Data Mining Lectures Lecture 9,10: Clustering Padhraic Smyth, UC Irvine
List of Sections for your Progress Report • Clear description of task (reuse original proposal if needed) • Basic task + extended “bonus” tasks (if time allows) • Discussion of relevant literature • Discuss prior published/related work (if it exists) • Preliminary data evaluation • Exploratory data analysis relevant to your task • Include as many of plots/graphs as you think are useful/relevant • Preliminary algorithm work • Summary of your progress on algorithm implementation so far • If you are not at this point yet, say so • Relevant information about other code/algorithms you have downloaded, some preliminary testing on, etc. • Difficulties encountered so far • Plans for the remainder of the quarter • Algorithm implementation • Experimental methods • Evaluation, validation • Approximately ½ page to 1 page of text per section (graphs/plots don’t count – include as many of these as you like). Data Mining Lectures Lecture 9,10: Clustering Padhraic Smyth, UC Irvine
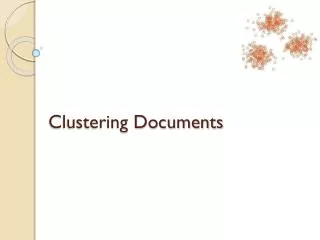
Clustering • “automated detection of group structure in data” • Typically: partition N data points into K groups (clusters) such that the points in each group are more similar to each other than to points in other groups • descriptive technique (contrast with predictive) • for real-valued vectors, clusters can be thought of as clouds of points in p-dimensional space Data Mining Lectures Lecture 9,10: Clustering Padhraic Smyth, UC Irvine
Clustering Data Mining Lectures Lecture 9,10: Clustering Padhraic Smyth, UC Irvine
Why is Clustering useful? • “Discovery” of new knowledge from data • Contrast with supervised classification (where labels are known) • Long history in the sciences of categories, taxonomies, etc • Can be very useful for summarizing large data sets • For large n and/or high dimensionality • Applications of clustering • Discovery of new types of galaxies in astronomical data • Clustering of genes with similar expression profiles • Cluster pixels in an image into regions of similar intensity • Segmentation of customers for an e-commerce store • Clustering of documents produced by a search engine • …. many more Data Mining Lectures Lecture 9,10: Clustering Padhraic Smyth, UC Irvine
General Issues in Clustering • Representation: • What types of clusters are we looking for? • Score: • The criterion to compare one clustering to another • Optimization • Generally, finding the optimal clustering is NP-hard • Greedy algorithms to optimize score are widely used • Other issues • Distance function, D(x(i),x(j)) critical aspect of clustering, both • distance of pairs of objects • distance of objects from clusters • How is K selected? • Different types of data • Real-valued versus categorical • Attribute-valued vectors vs. n2 distance matrix Data Mining Lectures Lecture 9,10: Clustering Padhraic Smyth, UC Irvine
General Families of Clustering Algorithms • partition-based clustering • e.g. K-means • probabilistic model-based clustering • e.g. mixture models [both of the above work with measurement data, e.g., feature vectors] • hierarchical clustering • e.g. hierarchical agglomerative clustering • graph-based clustering • E.g., min-cut algorithms[both of the above work with distance data, e.g., distance matrix] Data Mining Lectures Lecture 9,10: Clustering Padhraic Smyth, UC Irvine
Partition-Based Clustering • given: n data points X={x(1) … x(n)} • output: k partitions C = {C1 … CK} such that • each x(i) is assigned to unique Cj (hard-assignment) • C implicitly represents a mapping from X to C • Optimization algorithm • require that score[C, X] is maximized • e.g., sum-of-squares of within cluster distances • exhaustive search intractable • combinatorial optimization to assign n objects to k classes • large search space: possible assignment choices ~ kn • so, use greedy interative method • will be subject to local maxima Data Mining Lectures Lecture 9,10: Clustering Padhraic Smyth, UC Irvine
Score Function for Partition-Based Clustering • want compact clusters • minimize within cluster distances wc(C) • want different clusters far apart • maximize between cluster distances bc(C) • given cluster partitioning C, find centers c1…ck • e.g. for vectors, use centroids of points in cluster Ci • ck = 1/(nk) x Ck x • wc(C) = sum-of-squares within cluster distance • wc(C) = i=1…k wc(Ci) = i=1…k x Ci d(x,ci)2 • bc(C) = distance between clusters • bc(C) = i,j=1…k d(ci,cj)2 • Score[C,X]=f[wc(C),bc(C)] Data Mining Lectures Lecture 9,10: Clustering Padhraic Smyth, UC Irvine
K-means Clustering • basic idea: • Score = wc(C) = sum-of-squares within cluster distance • start with randomly chosen cluster centers c1 … ck • repeat until no cluster memberships change: • assign each point x to cluster with nearest center • find smallest d(x,ci), over all c1 … ck • recompute cluster centers over data assigned to them • ci = 1/(ni) x Ci x • algorithm terminates (finite number of steps) • decreases Score(X,C) each iteration membership changes • converges to local maxima of Score(X,C) • not necessarily the global maxima … • different initial centers (seeds) can lead to diff local maxs Data Mining Lectures Lecture 9,10: Clustering Padhraic Smyth, UC Irvine
K-means Complexity • time complexity = O(I e n k) << exhaustive’s nk • I = number of interations (steps) • e = cost of distance computation (e=p for Euclidian dist) • speed-up tricks (especially useful in early iterations) • use nearest x(i)’s as cluster centers instead of mean • reuse of cached dists from size n2 dist mat D (lowers effective “e”) • k-mediods: use one of x(i)’s as center because mean not defined • recompute centers as points reassigned • useful for large n (like online neural nets) & more cache efficient • PCA: reduce effective “e” and/or fit more of X in RAM • “condense”: reduce “n” by replace group with prototype • even more clever data structures (see work by Andrew Moore, CMU) Data Mining Lectures Lecture 9,10: Clustering Padhraic Smyth, UC Irvine
K-means example(courtesy of Andrew Moore, CMU) Data Mining Lectures Lecture 9,10: Clustering Padhraic Smyth, UC Irvine
K-means • Ask user how many clusters they’d like. (e.g. K=5) Data Mining Lectures Lecture 9,10: Clustering Padhraic Smyth, UC Irvine
K-means • Ask user how many clusters they’d like. (e.g. K=5) • Randomly guess K cluster Center locations Data Mining Lectures Lecture 9,10: Clustering Padhraic Smyth, UC Irvine
K-means • Ask user how many clusters they’d like. (e.g. K=5) • Randomly guess K cluster Center locations • Each datapoint finds out which Center it’s closest to. (Thus each Center “owns” a set of datapoints) Data Mining Lectures Lecture 9,10: Clustering Padhraic Smyth, UC Irvine
K-means • Ask user how many clusters they’d like. (e.g. k=5) • Randomly guess k cluster Center locations • Each datapoint finds out which Center it’s closest to. • Each Center finds the centroid of the points it owns Data Mining Lectures Lecture 9,10: Clustering Padhraic Smyth, UC Irvine
K-means • Ask user how many clusters they’d like. (e.g. k=5) • Randomly guess k cluster Center locations • Each datapoint finds out which Center it’s closest to. • Each Center finds the centroid of the points it owns • New Centers => new boundaries • Repeat until no change! Data Mining Lectures Lecture 9,10: Clustering Padhraic Smyth, UC Irvine
K-means • Ask user how many clusters they’d like. (e.g. k=5) • Randomly guess k cluster Center locations • Each datapoint finds out which Center it’s closest to. • Each Center finds the centroid of the points it owns… • …and jumps there • …Repeat until terminated! Data Mining Lectures Lecture 9,10: Clustering Padhraic Smyth, UC Irvine
AcceleratedComputations • Example generated by Pelleg and Moore’s accelerated k-means • Dan Pelleg and Andrew Moore. Accelerating Exact k-means Algorithms with Geometric Reasoning. Proc. Conference on Knowledge Discovery in Databases 1999, (KDD99) (available on www.autonlab.org/pap.html) Data Mining Lectures Lecture 9,10: Clustering Padhraic Smyth, UC Irvine
K-means continues… Data Mining Lectures Lecture 9,10: Clustering Padhraic Smyth, UC Irvine
K-means continues… Data Mining Lectures Lecture 9,10: Clustering Padhraic Smyth, UC Irvine
K-means continues… Data Mining Lectures Lecture 9,10: Clustering Padhraic Smyth, UC Irvine
K-means continues… Data Mining Lectures Lecture 9,10: Clustering Padhraic Smyth, UC Irvine
K-means continues… Data Mining Lectures Lecture 9,10: Clustering Padhraic Smyth, UC Irvine
K-means continues… Data Mining Lectures Lecture 9,10: Clustering Padhraic Smyth, UC Irvine
K-means continues… Data Mining Lectures Lecture 9,10: Clustering Padhraic Smyth, UC Irvine
K-means continues… Data Mining Lectures Lecture 9,10: Clustering Padhraic Smyth, UC Irvine
K-means terminates Data Mining Lectures Lecture 9,10: Clustering Padhraic Smyth, UC Irvine
Image Clusters on color K-means clustering of RGB (3 value) pixel color intensities, K = 11 segments (courtesy of David Forsyth, UC Berkeley) Data Mining Lectures Lecture 9,10: Clustering Padhraic Smyth, UC Irvine
Issues in K-means clustering • Simple, but useful • tends to select compact “isotropic” cluster shapes • can be useful for initializing more complex methods • many algorithmic variations on the basic theme • Choice of distance measure • Euclidean distance • Weighted Euclidean distance • Many others possible • Selection of K • “screen diagram” - plot SSE versus K, look for knee • Limitation: may not be any clear K value Data Mining Lectures Lecture 9,10: Clustering Padhraic Smyth, UC Irvine
P d Probabilistic Clustering: Mixture Models • assume a probabilistic model for each component cluster • mixture model: f(x) = k=1…K wk fk(x;k) • where wk are K mixing weights • wk : 0 wk 1 and k=1…K wk = 1 • where K components fk(x;k) can be: • Gaussian • Poisson • exponential • ... • Note: • Assumes a model for the data (advantages and disadvantages) • Results in probabilistic membership: p(cluster k | x) Data Mining Lectures Lecture 9,10: Clustering Padhraic Smyth, UC Irvine
Gaussian Mixture Models (GMM) • model for k-th component is normal N(k,k) • often assume diagonal covariance: jj = j2 ,ij = 0 • or sometimes even simpler: jj = 2 ,ij = 0 • f(x) = k=1…K wk fk(x;k) with k = <k , k> or <k ,k> • generative model: • randomly choose a component • selected with probability wk • generate x ~ N(k,k) • note: k & k both d-dim vectors Data Mining Lectures Lecture 9,10: Clustering Padhraic Smyth, UC Irvine
Learning Mixture Models from Data • Score function = log-likelihood L() • L() = log p(X|) = log H p(X,H|) • H = hidden variables (cluster memberships of each x) • L() cannot be optimized directly • EM Procedure • General technique for maximizing log-likelihood with missing data • For mixtures • E-step: compute “memberships” p(k | x) = wk fk(x;k) / f(x) • M-step: pick a new to max expected data log-likelihood • Iterate: guaranteed to climb to (local) maximum of L() Data Mining Lectures Lecture 9,10: Clustering Padhraic Smyth, UC Irvine
The E (Expectation) Step Current K clusters and parameters n data points E step: Compute p(data point i is in group k) Data Mining Lectures Lecture 9,10: Clustering Padhraic Smyth, UC Irvine
The M (Maximization) Step New parameters for the K clusters n data points M step: Compute q, given n data points and memberships Data Mining Lectures Lecture 9,10: Clustering Padhraic Smyth, UC Irvine
Complexity of EM for mixtures K models n data points Complexity per iteration scales as O( n K f(p) ) Data Mining Lectures Lecture 9,10: Clustering Padhraic Smyth, UC Irvine
Comments on Mixtures and EM Learning • Complexity of each EM iteration • Depends on the probabilistic model being used • e.g., for Gaussians, Estep is O(nK), Mstep is O(Knp2) • Sometimes E or M-step is not closed form • => can requires numerical methods at each iteration • K-means interpretation • Gaussian mixtures with isotropic (diagonal, equi-variance) k‘s • Approximate the E-step by choosing most likely cluster (instead of using membership probabilities) • Generalizations… • Mixtures of multinomials for text data • Mixtures of Markov chains for Web sequences • etc Data Mining Lectures Lecture 9,10: Clustering Padhraic Smyth, UC Irvine
Data Mining Lectures Lecture 9,10: Clustering Padhraic Smyth, UC Irvine
Data Mining Lectures Lecture 9,10: Clustering Padhraic Smyth, UC Irvine
Data Mining Lectures Lecture 9,10: Clustering Padhraic Smyth, UC Irvine
Data Mining Lectures Lecture 9,10: Clustering Padhraic Smyth, UC Irvine
Data Mining Lectures Lecture 9,10: Clustering Padhraic Smyth, UC Irvine
Data Mining Lectures Lecture 9,10: Clustering Padhraic Smyth, UC Irvine
Data Mining Lectures Lecture 9,10: Clustering Padhraic Smyth, UC Irvine
Data Mining Lectures Lecture 9,10: Clustering Padhraic Smyth, UC Irvine
Selecting K in mixture models • cannot just choose K that maximizes likelihood • Likelihood L() ALWAYS larger for larger K • Model selection alternatives: • 1) penalize complexity • e.g., BIC = L() – d/2 log n (Bayesian information criterion) • 2) Bayesian: compute posteriors p(k | data) • Can be tricky to compute for mixture models • 3) (cross) validation: popular and practical • Score different models by log p(Xtest | ) • split data into train and validate sets Data Mining Lectures Lecture 9,10: Clustering Padhraic Smyth, UC Irvine
Example of BIC Score for Red-Blood Cell Data Data Mining Lectures Lecture 9,10: Clustering Padhraic Smyth, UC Irvine
Data Mining Lectures Lecture 9,10: Clustering Padhraic Smyth, UC Irvine
Hierarchical Clustering • Representation: tree of nested clusters • Works from a distance matrix • advantage: x’s can be any type of object • disadvantage: computation • two basic approachs: • merge points (agglomerative) • divide superclusters (divisive) • visualize both via “dendograms” • shows nesting structure • merges or splits = tree nodes • Applications • e.g., clustering of gene expression data • Useful for seeing hierarchical structure, for relatively small data sets Data Mining Lectures Lecture 9,10: Clustering Padhraic Smyth, UC Irvine