Download
1 / 44
460 likes | 639 Views
Pattern Recognition. K-Nearest Neighbor Explained By Arthur Evans John Sikorski Patricia Thomas. Overview. Pattern Recognition, Machine Learning, Data Mining: How do they fit together? Example Techniques K-Nearest Neighbor Explained. Data Mining.

E N D
Pattern Recognition K-Nearest Neighbor Explained By Arthur Evans John Sikorski Patricia Thomas
Overview • Pattern Recognition, Machine Learning, Data Mining: How do they fit together? • Example Techniques • K-Nearest Neighbor Explained
Data Mining • Searching through electronically stored data in an automatic way • Solving problems with already known data • Essentially, discovering patterns in data • Has several subsets from statistics to machine learning
Machine Learning • Construct computer programs that improve with use • A methodology • Draws from many fields: Statistics, Information Theory, Biology, Philosophy, Computer Science . . . • Several sub-disciplines: Feature Extraction, Pattern Recognition
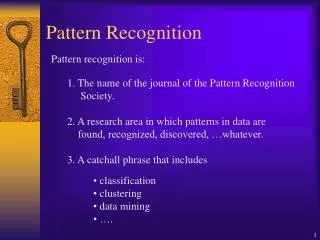
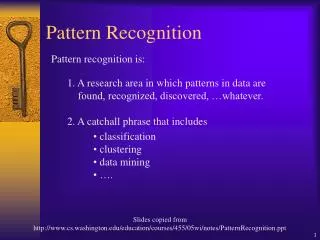
Pattern recognition • Operation and design of systems that detect patterns in data • The algorithmic process • Applications include image analysis, character recognition, speech analysis, and machine diagnostics.
Pattern Recognition Process • Gather data • Determine features to use • Extract features • Train your recognition engine • Classify new instances
Artificial Neural Networks • A type of artificial intelligence that attempts to imitate the way a human brain works. • Creates connections between processing elements, computer equivalent of neurons • Supervised technique
ANN continued • Tolerant of errors in data • Many applications: speech recognition, analyze visual scenes, robot control • Best at interpreting complex real world sensor data.
The Brain • Human brain has about 1011 neurons • Each connect to about 104 other neurons • Switch in about 10-3 seconds • Slow compared to a computers at 10-13 seconds • Brain recognizes a familiar face in about 10-1 seconds • Only 200-300 cycles at its switch rate • Brain utilizes MASSIVE parallel processing, considers many factors at once.
Bayesian Theory • Deals with statistical probabilities • One of the best for classifying text • Require prior knowledge about the expected probabilities
Conveyor Belt Example • Want to sort apples and orange on conveyor belt. • Notice 80% are orange, therefore 80% are oranges. • Bayesian theory says Decide worg if P(worg|x) > P(wapp|x); otherwise decide wapp
Clustering • A process of partitioning data into meaningful sub-classes (clusters). • Most techniques are unsupervised. • Two main categories: • Hierarchical: Nested classes displayed as a dendrogram • Non-Hierarchical: Each class in one and only one cluster – not related.
Rattus norvegicus Mus musculus Homo sapiens Equus caballus Gallus gallus Oryctolagus cuniculus Macaca mulatta Phylogenetic Tree - Hierarchical Ciliary Neurotrophic Factor
Initial cluster seeds Initial cluster boundaries K-Means Method
After one iteration. New cluster assignments
Decision Tree • A flow-chart-like tree structure • Internal node denotes a test on an attribute (feature) • Branch represents an outcome of the test • All records in a branch have the same value for the tested attribute • Leaf node represents class label or class label distribution
Example of Decision Tree outlook sunny overcast rain humidity windy P high normal true false N P N P Decision Tree forecast for playing golf
Instance Based Learning • Training consists of simply storing data • No generalizations are made • All calculations occur at classification • Referred to as “lazy learning” • Can be very accurate, but computationally expensive
Instance Based Methods • Locally weighted regression • Case based reasoning • Nearest Neighbor
Advantages • Training stage is trivial therefore it is easily adaptable to new instances • Very accurate • Different “features” may be used for each classification • Able to model complex data with less complex approximations
Difficulties • All processing done at query time: computationally expensive • Determining appropriate distance metric for retrieving related instances • Irrelevant features may have a negative impact
Case Based Reasoning • Does not use Euclidean space • Represented as complex logical descriptions • Examples • Retrieve help desk information • Legal reasoning • Conceptual design of mechanical devices
Case Based Process • Based on idea that current problems similar to past problems • Apply matching algorithms to past problem-solution pairs
(Ax-Bx)2+(Ay-By)2… D= Nearest Neighbor • Assumes all instances correspond to points in n-dimensional space • Nearest neighbor defined as instance closest in Euclidean space
Feature Extraction • Features: unique characteristics that define an object • Features used depend on the problem you are trying to solve • Developing a good feature set is more art than science
Sample Case – Identify Flower Species • Consider two features: • Petal count: range from 3-15 • Color: range from 0-255 • Assumptions: • No two species have exactly the same color • Multiple species have same petal count
Species A Color Species B Query Petal count Graph of Instances
Species A Color Species B Query Petal count Calculate Distances
Species A Color Species B Query Petal count Species is Closest Neighbor Nearest Neighbor
Problems • Data range for each feature is different • Noisy data may lead to wrong conclusion • One attribute may hold more importance
Color 0 3 15 Petal count Without Normalization 255
Color Petal count Normalized Normalize by subtracting smallest value from all then divide by largest All values range from 0-1 1 0 0 1
Noise Strategies • Take an average of the k closest instances • K-nearest neighbor • Prune noisy instances
Species A Color Species B Query Petal count K-Nearest Neighbors K = 5 Identify as majority of k nearest neighbors
Prune “Noisy” Instances • Keep track of how often an instance correctly predicts a new instance • When the value drops below a certain threshold, remove it from the graph
Species A Species B Query “Pruned” Graph Color Petal count
Avoid Over Fitting - Occams Razor A: Poor but simple B: Good but less simple C: Excellent but too data specific
2 Color 0 0 1 Petal Count Weights Weights are added to features more significant than others in producing accurate predictions. Multiply the feature value by the weight.
Validation • Used to calculate error rates and overall accuracy of recognition engine • Leave One out: Use n-1 instances in classifier, test, repeat n times. • Holdout: Divide data into n groups, use n-1 groups in classifier, repeat n times • Bootstrapping: Test with a randomly sampled subset of instances.
Potential Pattern Recognition Problems • Are there adequate features to distinguish different classes. • Are the features highly correlated. • Are there distinct subclasses in the data. • Is the feature space too complex.