Download
1 / 8
80 likes | 272 Views
Linear Programming. 1.4 Algebra II. What is Linear Programming. The process of taking various linear inequalities relating to some situation, and finding the "best" value obtainable under those conditions

E N D
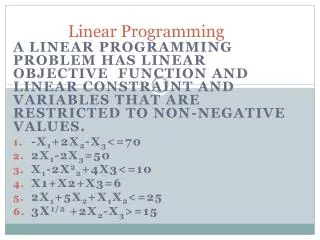
Linear Programming 1.4 Algebra II
What is Linear Programming • The process of taking various linear inequalities relating to some situation, and finding the "best" value obtainable under those conditions • Example - taking the limitations of materials and labor, and then determining the "best" production levels for maximal profits under those conditions • In "real life", linear programming is part of a very important area of mathematics called "optimization techniques". This field of study (or at least the applied results of it) are used every day in the organization and allocation of resources. These "real life" systems can have dozens or hundreds of variables, or more. In algebra, though, you'll only work with the simple (and graphable) two-variable linear case.
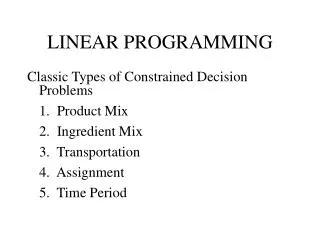
The Process • Graph the inequalities (called the "constraints") to form a walled-off area on the x,y-plane (called the "feasibility region") • Figure out the coordinates of the corners of this feasibility region (that is, you find the intersection points of the various pairs of lines) • Test these corner points in the formula (called the "optimization equation") for which you're trying to find the highest or lowest value.
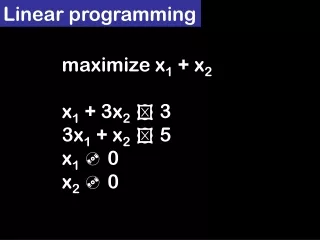
x x x y y y Example 1 Find the maximal and minimal value of z = 3x + 4y subject to the following constraints: Step 1: Graph the system (T-chart for each, plot points, connect points, and shade)
Example 1 cont… Graph: Step 2: Find the corner points (2, 6), (6, 4), and (–1, –3) Step 3: Plug these points into z = 3x + 4y (2, 6): z = 3(2) + 4(6) = 6 + 24= 30 (6, 4): z = 3(6) + 4(4) = 18 + 16 = 34 (–1, –3): z = 3(–1) + 4(–3) = –3 –12 = –15 Step 4: Determine the maximum and minimum Maximum of z = 34 occurs at (6, 4) Minimum of z = –15 occurs at (–1, –3)
Example 2 Given the following constraints, maximize and minimize the value of z = –0.4x + 3.2y.
Example 2 cont… Graph: Step 2: There are 6 corner points (1, 6), (5, 2), (5, 0), (4, 0), (0, 2), (0, 5) Step 3: Plug these point into z = –0.4x + 3.2y. (1, 6): z = –0.4(1) + 3.2(6) = –0.4 + 19.2 = 18.8 (5, 2): z = –0.4(5) + 3.2(2) = –2.0 + 6.4 = 4.4 (5, 0): z = –0.4(5) + 3.2(0) = –2.0 + 0.0 = –2.0 (4, 0): z = –0.4(4) + 3.2(0) = –1.6 + 0.0 = –1.6 (0, 2): z = –0.4(0) + 3.2(2) = –0.0 + 6.4 = 6.4 (0, 5): z = –0.4(0) + 3.2(5) = –0.0 + 16.0 = 16.0 Then the maximum is 18.8 at (1, 6) and the minimum is –2 at (5, 0).
Homework • Quiz Monday! • Homework: Worksheet 1.4