Download
1 / 18
180 likes | 190 Views
California's Climate Action Team established GHG emission reduction targets by 2050 to combat climate change impacts. The team recommends various strategies including market-based programs and environmental justice considerations. The program aims to reduce emissions from various sectors like transportation, buildings, and agriculture to meet set targets and promote sustainable practices.

E N D
Executive Order Established Statewide GHG Targets By 2010, Reduce to 2000 Emission Levels* By 2020, Reduce to 1990 Emission Levels** By 2050, Reduce to 80% Below 1990 Levels * Equals 60 Million Tons Emission Reductions, 11% Below BAU ** Equals 175 Million Tons Emission Reductions, 30% Below BAU
Climate Action Team • CalEPA Secretary Chairs the Team • BT&H, CDFA, Resources, PUC, ARB, CIWMB, and CEC are Represented • The CAT Report: • Key Recommendations • Emission Reduction Strategies • Market-based Program • Scenario Analysis • Environmental Justice Considerations • Report to Governor and Legislature in March 2006 and Biennially Thereafter
Key Recommendations • Coming Soon….. • Build on December 8 Draft Report • Mandatory Reporting • Early Action Credit • Investment Strategy • Public Goods Charge for Transportation • Modifications made as a Result of Public Comment • 15,000+ Commenters, Few Hundred that Contributed Substantive Comments
Strategies Underway • Motor Vehicle Regulations • Efficiency Measures • Renewable Portfolio Standard • California Solar Initiative • Hydrogen Highway • Green Buildings • Recycling and Waste Reduction
CAT Recommended Strategies • The CAT Recommends a Broad Range of Strategies including: • HFC Reductions • Forest Management • Water Use Efficiency • Appliance and Building Efficiency, Including LSEs and Municipal Utilities • Smart Land Use • Conservation Tillage
Based on Best Available Information to Date, Implementation of These Strategies will Achieve the Governor’s Targets
Market-Based Program • Market-Based Program Integral To California’s Strategy For Reducing Emissions • National Approach To Capping Emissions Within An International Framework Most Effective • In The Absence Of National Action, California Can Lead By Example By Developing A Market-Based Program As A Model For National Action
Market-Based Program Design • Design Options • Scope: Which Sources To Cover • Distribute of Emission Allowances • Auction • Emission Offsets • Other: Banking; Compliance Tracking; Gases To Cover • Facility-Level Emissions Data Needed
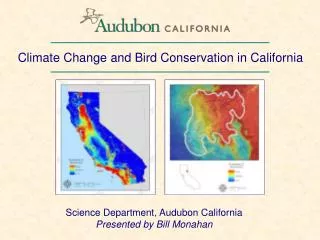
Scenarios Higher Emissions • Global Emission Scenarios: A1fi, A2, And B1 • Global Climate Models: GFDL, PCM, And Hadley3 • Temperature And Precipitation Downscaled To California • Use Of An Hydrological Model (VIC) To Produce The Needed Hydrological Products Medium-high Emissions Lower Emissions Projected Annual Mean Temperatures In California
Coastal Sea Level • Projections For The 2070-2099 Period • 5 To 24 Inches (B1) • 7 To 30 Inches (A2) • 8 To 35 Inches (A1fi) • Salt Water Intrusion into Levees and Flooding Risks Observed Changes Projections of global mean sea level rise
Water Resources • Declining Snow Pack Will Aggravate The Already Overstretched Water Resources In The State • Increased Flooding Risk • Potential Up To 90 Percent Reductions Of April 1st Snow Levels
Agriculture • Many Species Of Fruit Tress May Not Grow In The State Due The Lack Of Needed Winter Chill Hours • Some Pests Such As The Cotton/Pink Bollworm (Pbw) Will Increase Their Ranges The effect of total seasonal pest PBW larval densities (larval days) under current weather (d) and with 2.5 degrees C (f) increase in daily temperature
Forest and Natural Landscapes • Changes In Vegetation Patterns Will Occur • The Alpine And Subalpine Ecosystems Are Most Susceptible • Increases In The Number Of Large Fires Almost By 35% By Mid-century And 55% By The End Of This Century Under The A2 Scenario • Fire Impacts Are Less Severe Under The B1 Scenario (Lower Global Emissions) Percent change in the expected minimum Number of large fires per year in California
Public Health • Increase Of Heat-related Mortality • It Will Be More Difficult To Comply With Ambient Air Quality Standards For Ozone Projected annual heat-related mortality for 2070-2099 and historic mortality for 1971-200 Projected days with meteorology conducive to exceedances Of the 1-hour state ambient air quality standard for ozone
Electricity • Annual Hydropower Generation Will Decrease If Climate Change Reduces Precipitation Levels • Electricity Demand Will Increase With Temperature From 3 To 20 % By The End Of This Century
Next Two Years • Climate Action Team Will Work Together to Implement Emission Reduction Strategies • Market-Based Options Evaluated and Recommendations Made • Refine Economic Analysis • Continue Scenario Analysis including Adaptation Options