Download
1 / 17
180 likes | 453 Views
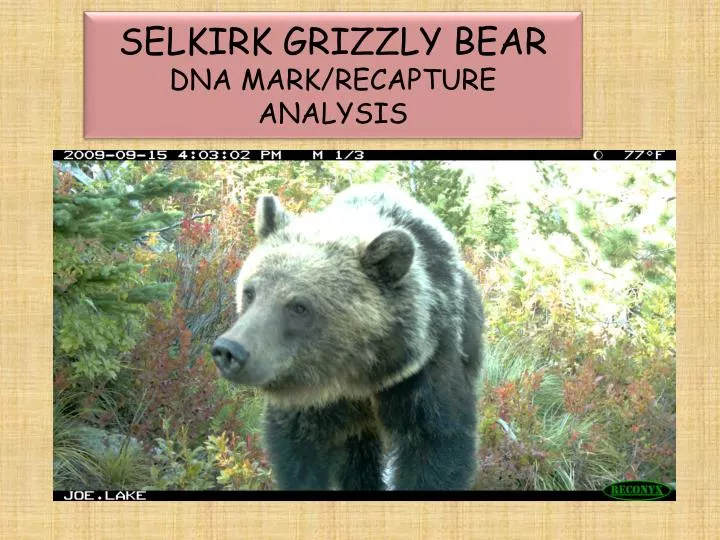
SELKIRK GRIZZLY BEAR DNA MARK/RECAPTURE ANALYSIS. MARK/RECAPTURE EXPLAINED. 1 ST you catch some animals in a pop n and “mark” them Later on you catch animals in the same pop n Some of those will be new animals, some will be recaptures

E N D
MARK/RECAPTURE EXPLAINED • 1ST you catch some animals in a popn and “mark” them • Later on you catch animals in the same popn • Some of those will be new animals, some will be recaptures • You use the ratio of “marked” to “recapture” to get a popnestimate
MARK/RECAPTURE N = Popn size M = # initially marked n = # caught in 2nd effort m = # recaptured
CRITICAL ASSUMPTIONS • Marks must be permanent • All animals have an equal probability of getting caught • No changes in population between initial mark and later recapture
MARK/RECAPTURE example • 1st mark: Trap 20 mice, paint their toenails red • Recapture: 1 week later, trap again; catch 16 mice, 4 have red toenails So, N = (20 x 16) / 4, which equals 80
50 barbed-wire enclosures • 470 sq miles • Visited each site 4 times • Collected over 1,200 hair samples
RESULTS • ID 15 different grizzly bears • 9 females, 6 males • 15 bears captured a total of 50 times • Multiple capture sessions allows for more complicated analysis • Test for diff male/female capture probability, diff capture prob among sessions, trap happy, trap shy
RESULTS • Best model estimated 18 grizzly bears • 11 females, 7 males • Density 14.1 bears / 1,000 sq km (naïve estimate) 9.7 bears / 1,000 sq km (SECR estimate) 3.6 bears / 100 sq miles 2.5 bears / 100 sq miles
CAUTIONS about mark/recap • Point Estimate – says nothing about trend • Density cannot be extrapolated to the entire ecosystem • No info on reproduction