Download
1 / 24
240 likes | 689 Views
Global Trade Analysis: introduction to the GTAP modelling framework Frank van Tongeren Trade and development division, LEI Outline Introduction: motivation for GTAP Database Model Some economics GTAP organisation Motivation for GTAP

E N D
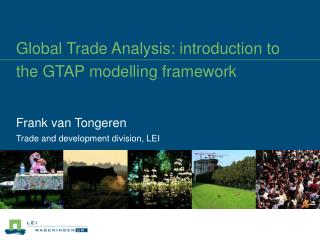
Global Trade Analysis: introduction to the GTAP modelling framework Frank van Tongeren Trade and development division, LEI
Outline • Introduction: motivation for GTAP • Database • Model • Some economics • GTAP organisation
Motivation for GTAP • Increasing demand for quantitative analysis of global trade issues • E.g., WTO Doha round, Kyoto agreement, EU integration, Regional integration • Historically analysis has been done “in-house” in a few agencies: USDA, FAO, World Bank
Limitations of Agency-based Projects • Methodology is often poorly documented. • Rarely subjected to peer review. • Data base is treated as a strategic asset and therefore not shared with others. • Projects rarely survive change of administration. • Unfavorable findings result in termination.
Limitations of Projects Based in Academia • Limited financial support. • Little incentive to invest in data base. • Tendency to keep model and data until it has outlived its usefulness. • Limited contact with decision makers who are the ultimate “clientele” for much of this work.
The GTAP Approach • Publicly funded project, based in academia. • Data base and standard model: • fully documented • publicly available at modest cost • easy to use with regular courses • accessible to non-modelers.
Key Resources: Data Base • Philosophy: • Find the best person in the world to do the job • GTAP as an assembler of information • Reconciled bilateral trade data and shipping margins: USDA • Protection data: WTO/WBank/UNCTAD, AMAD • National data bases: national collaborators • e.g Version 5 EU-15 Input-Output tables, LEI with funding from DG-ENVIRON • Production cycle database: 18-24 Months
Primary agriculturePaddy rice Wheat Cereal grains nec Vegetables, fruit, nuts Oil seeds Sugar cane, sugar beet Plant-based fibers Crops nec Cattle,sheep,goats,horses Animal products nec Raw milk Wool, silk-worm cocoons Natural resource based activities Forestry Fishing Coal Oil Gas Minerals nec Processing agriculture and food Meat: cattle,sheep,goats,horse Meat products nec Vegetable oils and fats Dairy products Processed rice Sugar Food products nec Beverages and tobacco products ManufacturingTextiles Wearing apparel Leather products Wood products Paper products, publishing Petroleum, coal productsChemical,rubber,plastic prodsMineral products nec Ferrous metals Metals nec Metal products Motor vehicles and parts Transport equipment nec Electronic equipment Machinery and equipment nec Manufactures nec ServicesElectricity Gas manufacture, distribution Water Construction Trade Transport nec Sea transport Air transport Communication Financial services nec Insurance Business services nec Recreation and other services PubAdmin/Defence/Health/Educat Dwellings GTAP v6 commodities
Additional data on energy use: • Coal, oil, gas, petroleum products, electricity • Volumes (Mtoe) and prices • Harmonized and consistent • Biomass small share -> not (yet) separate
GTAP v6 regions • 87 regions (built from 226 members) • Economy-wide coverage • Input-Output tables • Bilateral trade flows • Policy data • Benchmarked to year 2001
Key Resource: a standard multi-region CGE model • profit maximizing behaviour of producers (input restraint) • utility maximizing behaviour of consumers(budget constraint) • Armington approach: bilateral trade • Computable General Equilibrium (CGE): all markets clear simultaneously • Product markets • Factor markets (capital, labour, land, natural res.) • Prices and quantities determined by model
Economics of production: Cost Minimizing Behavior • Behavioural equations are derived from an economic decision problem: • Choose cost minimizing input mix, given the technical characteristics of production, and given prices: Cost function: C(w, q) = min wi xi st.: q = f(x) C(w, q) Factor demand: ----------- = xi(q, w) (Shephard’s lemma) wi
Pricing • Constant returns to scale production function means:average cost = marginal cost • Competitive pricing at marginal cost. • Therefore revenue = costsZero Pure Profits:
Market clearing • On all markets we have: Qd = Qs • Product markets: 56 commodities • Factor markets: Land, SkLabour, UnskLabour, Capital, Nat resources • Savings = Investment ; Global bank
Small example: EU sugar reforms % change in sugar output under EBA and EU reform • EBA: LDCs get quota & duty free access to EU • EU reforms: • Beet quota down,Internal support price down
EU sugar reforms: welfare effects Trade diversion effect
Modifications to standard GTAP model • Network members add new model developments: • For example: • imperfect competition and increasing returns to scale • international technology spillovers • Modelling specific policies, e.g EU CAP • Projections in time • Dynamic extensions (GTAPDyn) • Modelling of agricultural supply • GTAP-E: energy model
GTAP organization • Core funding from international consortium, 18 international and national agencies, e.g: • WTO, World Bank, UNCTAD, USDA/ERS, OECD, • MIT, USEPA ...LEI (member since Nov. 96) • Each represented on the advisory board • Headquarters Purdue Univ., Tom Hertel
Growth of GTAP Consortium • Five international: OECD, WB, WTO, UNCTAD • 11 national: Australia, Denmark, Germany, Netherlands, Japan, US • Two non-profit
GTAP organization (II) • Open network of contributors • more than 350 course alumni • annual global conference • Linked through WWW for distribution of database, software and publications: www.gtap.org
Summary • GTAP relatively unique in economics, but similar to consortia in sciences • Success of project traced back to courses • Consortium key to long term viability: provides $, but also key data inputs and much needed direction • Modest contribution by many agencies provides long run stability • Network externalities
There are many ways to get involved • Short course attendance = usually first step • Purchase database and Gempack software • Attend annual GTAP conference (approx 150 specialists in gobal economic analysis meet) • 2003: The Netherlands, The Hague • 2004: USA, Washington DC • 2005: Germany, Lübeck
cooperate END make or buy?