Download
1 / 39
390 likes | 423 Views
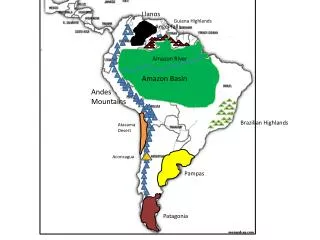
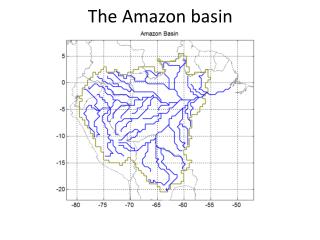
This study examines the seasonal dynamics of the Amazon Basin using MODIS vegetation indices, focusing on land use conversions, forest transitions, and climate-based ecological transects. The research evaluates the two-year MODIS data in characterizing seasonality in various regions, from cerrado to tropical rainforests, and investigates the impacts of land conversions on vegetation. The study aims to provide insights into the reliability, limitations, and usefulness of MODIS data for understanding vegetation changes over time.

E N D
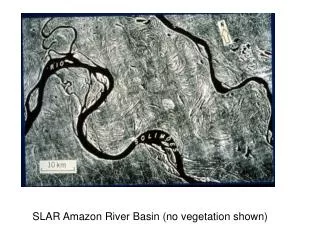
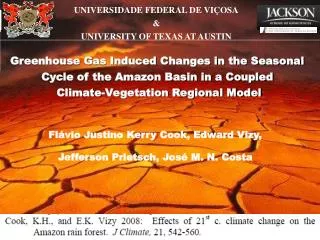
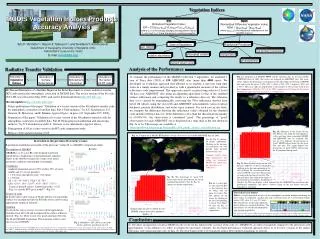
Seasonal Variability Studies Across the Amazon Basin with MODIS Vegetation Indices MOD13 Alfredo Huete1, Kamel Didan1, Piyachat Ratana1, Laerte Ferreira2, Yosio Shimabokuro3, Tomoaki Miura1 Gao Xiang1 1University of Arizona, Tucson, Arizona USA 2Universidade Federal de Goiás – UFG laerte@iesa.ufg.br 3Instituto Nacional de Pesquisas Espaciais - INPE yosio@ltid.inpe.br *Terrestrial Biophysics and Remote Sensing Lab University of Arizona MODIS Science Meeting
Phenology (seasonality) MOD13(VI) MOD09 (SR)---> Change detection (Interannual) Biophysical (growth models) Validation • Validation concerns the outputs or the intended uses of the VI’s so as to help the user community understand the reliability, credibility, and limitations of the products. MODIS Science Meeting
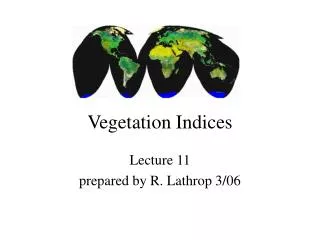
Atmosphere NDVI ARVI Normalized Difference Vegetation Index Resistance Canopy Background Correction EVI SAVI Soil-adjusted Vegetation Index Enhanced Vegetation Index MODIS Vegetation Indices MODIS Science Meeting
Long term, time series AVHRR-NDVI data(Pathfinder 8km -yearly averaged) Pinatubu El Niño Sensor degradation • Accurate and stable time series data is needed for studies on interannual variation of vegetation in response to climate and for characterization of vegetation anomalies at continental and regional scales. MODIS Science Meeting
Seasonality & Phenology Role *20 year averaged monthly AVHRR - NDVI in Brazil (Pathfinder 8 km) MODIS Science Meeting
Objectives • Evaluate the initial two years of MODIS Vegetation Index (VI) time series data over the Amazon Basin and surrounding regions of Brazil, • Examine the usefulness of MODIS data in characterizing seasonality along a climate-based ecological transect from the Brazilian cerrado to the seasonal tropical rainforests, • Examine the usefulness of MODIS data in discriminating land use/conversion patterns and in characterizing the resulting changes in seasonality. MODIS Science Meeting
MODIS EVI Seasonality (2000-2002) MODIS Science Meeting
Histograms of VI’s at 250 m, 500 m, and 1 km resolutions NDVI EVI South America (August 12 to August 27, 2000) MODIS Science Meeting
Brasilia National Park • Blue = ASD • Yellow = Digital Images MODIS Science Meeting
MQUALS and MODIS(Global) MODIS MODIS Science Meeting
EVI Histogram of Brasilia Tile (Cerrado + conversions) Dry 8/00 8/01 Wet 3/02 4/01 0.00 0.20 0.40 0.60 0.80 1.00 EVI MODIS Science Meeting
Cerrado Physiognomies MODIS Science Meeting
Cangaçu & Santana do Araguaia • Red = ASD • Yellow = Digital Images MODIS Science Meeting
MODIS VI Seasonal Profiles of Land Converted Areas MODIS 250m EVI Primary Forest(“High”) Pasture site biomass: 147.16 to 205.29 t / ha LAI: 5.61 to 7.06 biomass: ~1.3 t / ha LAI: ~2.82 Regeneration site biomass: 6.85 to 134.94 t / ha LAI: 4.11 to 6.27 MODIS Science Meeting
Land Conversion at Santana do Araguaia & Cangaçu (Forest - Cerrado Transition) Converted Pastures Forest Cerrado MODIS Science Meeting
EVI Histogram of Tapajos Tile (Seasonal Forest) Wet 7/01 4/02 Dry 11/00 11/01 0.00 0.20 0.40 0.60 0.80 1.00 EVI MODIS Science Meeting
Litterfall Seasonal Dynamics (Tapajos) (Woods Hall/ LBA/ <ftp://ftp.as.harvard.edu/pub/tapajos/>) MODIS Science Meeting
Forest open closed Cerrado MODIS Science Meeting
Forest closed open Cerrado MODIS Science Meeting
Conclusions (Brazil) • We found MODIS to be useful in characterizing the spatial and temporal dynamics of the Amazon Basin, • Multitemporal profiles of the MODIS data revealed well-defined seasonal patterns in the cerrado region with decreasing dry-wet seasonal patterns in the transitional areas near Santana do Araguaia, • Seasonality was observed to a small and uncertain extent at the Tapajos National Forest site, however, it was unclear whether this was associated with seasonal changes in forest leaf area or temporal changes in understory vegetation, • We further found MODIS VI seasonal patterns to significantly vary in land converted areas. MODIS Science Meeting
Algorithm summary Composite result MODIS Science Meeting
Clouds, cloud shadow, and BRDF induce the largest uncertainties. MODIS Science Meeting
Snow Problem in VI’s NDVI EVI • Snow effects: • Blue > Red > NIR • NDVI gives false negative signal • EVI gives false positive signal MODIS Science Meeting
EVI & SAVI Relationships for Snow MODIS Data (2000-2001) RT-Model EVI MODIS Science Meeting
NDVI & EVI Relationships MODIS Data (2000-2001) RT-Model MODIS Science Meeting
Biophysical Validation MODIS Science Meeting
Mongu NDVI and Fpar (2000-2002) 0.7 0.6 0.5 0.4 0.3 0.2 0.1 0 0 60 120 180 240 300 360 420 480 540 600 660 720 780 Cumulative Days Trac Fpar MODIS NDVI Trac SZA 10° to 30° Trac SZA 30º to 50º Trac SZA 50º to 75º Huemmrich and Privette MODIS Science Meeting
Conclusions • VI products are provisionally validated from radiometric, seasonal, interannual and biophysical perspectives, • product accuracy has been assessed by a number of independent measurements, at a number of locations or times representative of conditions portrayed by the product. • Residual cloud, cloud shadow, BRDF, topography, and snow induce the largest uncertainties in the VI’s, • Assessment of feasibility of using snow product and BRDF products. • VI product accuracy varies with QA. MODIS Science Meeting