Download
1 / 31
320 likes | 475 Views
Carrots and Genomics. An Introduction to the application of Molecular Markers. Outline of presentation. General introduction The plant cell DNA Cell division , production of gametes PCR Molecular Markers Application in carrot breeding. The plant. The plant cell. Cell wall.

E N D
Carrots and Genomics An Introduction to the application of Molecular Markers
Outline of presentation • General introduction • The plant cell • DNA • Celldivision, production of gametes • PCR • Molecular Markers • Application in carrotbreeding
The plant cell Cell wall Cell membrane Cytoplasm Mitochondrion Vacuole Nucleus nuclear DNA (Chloroplast)
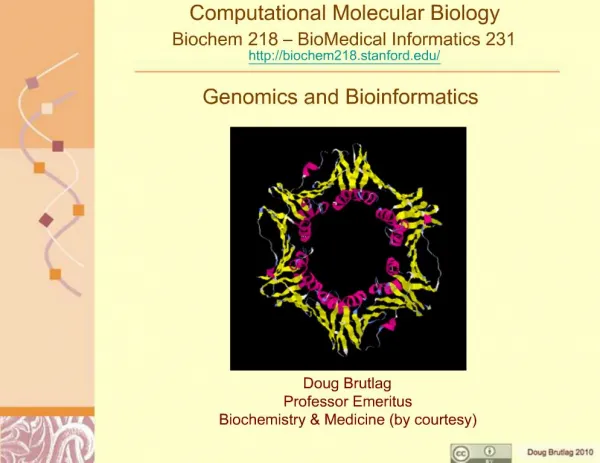
Nucleus with DNA 2n = 18 Total size carrot genome: 473 Mbp
The plant • Within a plant, all plant cells contain the same DNA • For plant growth, cells need to divide • Prior to cell division → DNA duplication
DNA duplication Double stranded DNA Separation of two strands Incorporation of nucleotides Two copies of double stranded DNA
Cell Division DNA duplication Mitosis 2 identical diploïd cells
Production of gametes DNA duplication Meiosis 4 unique haploïd gametes
Summary • A plant consists of many different cells, each with identical DNA content • DNA consists of two complementary strands • During duplication, each strand acts as a template to produce two identical copies • Duplication of DNA occurs prior to: • Cell division → two identical diploïd cells • Gamete production → four unique haploïd cells
PCR • Polymerase Chain Reaction • Amplification of DNA • Mimics the process of DNA duplication in the plant • The polymerase (enzyme) requires dsDNA to start building in nucleotides
PCR denaturation annealing elongation
PCR 1st cycle —› 2nd cycle —› 3rd cycle —› 4th cycle ‒ ‒ – —› 30th cycle 230 ~ 1 billion copies 21 = 2 copies 22 = 4 copies 23 = 8 copies 24 = 16 copies PCR: amplification of a specificregion of the genomedefinedby the sequence of the primers used in the reaction
Molecular Markers • Amplify a specificregion of the genomethrough PCR • Visualize the amplified fragment • Performthis step for different parentlines • Whenanamplified fragment is different fortwoparentlinesitbecomes a molecular marker
Molecular Markers A BM 600 bp M is a molecular size marker 500 bp 400 bp 300 bp 200 bp 100 bp
Molecular Markers Testing the % of inbreds in a hybrid seedlot (example from cabbage) A B M Individual seedlings from a hybrid seedlot
Molecular Markers: SNP • Single Nucleotide Polymorphism • Sequence information from multiple parent lines • SNP discovery:
Molecular Markers: SNP 384 SNPs 192 samples per day
Applications in carrot breeding Mapping a trait
Mapping a trait • Create a population segregating for your trait (~250 individuals) • Genotype the population • Phenotype the population • Combine these data to find the location of your trait on the genome
Mapping a trait A B F1 Crossing X Selfing (plant forms gametes)
Producing gametes DNA duplication Meiosis 4 unique gametes
Mapping a trait A B F1 Crossing X Selfing F1S1 population
Mapping a trait Genotyping b h h h h a a h h b b a b h b h a h b h b h h a h h h b h a b h b h a h h h b a h a b b h b h h b h h h a h a h h a h h b b h h h h b b a h a a a b h a h h b h h a a b b b a b a a a b a a h b b h b a a b h h a b a h
Mapping a trait Phenotyping r r s r r r s r r s r r s r s r r r
Mapping a trait Combining data b h h h h a a h h b b a b h b h a h b h b h h a h h h b h a b h b h a h r r s r r r s r r s r r s r s r r r h h b a h a b b h b h h b h h h a h a h h a h h b b h h h h b b a h a a a b h a h h b h h a a b b b a b a a a b a a h b b h b a a b h h a b a h
Mapping a trait Combining data b h b h h a h h h b h a b h b h a h h h b h h a b h h b h h b h b h a h r r s r r r s r r s r r s r s r r r h h b h h a b h h b h h b h b h a h h h b a h a b b h b h h b h h h a h
Mapping a trait • Errors in scoring make the analysis more complex • Better phenotyping results in better mapping • Easy for traits determined by a single gene: one locus on the genome
Mapping a trait • For complex traits use QTL mapping • QTLs: Quantative Trait Loci • Genotyping and phenotyping a population • Use computer software to statistically calculate the positions on the genome (loci) that have an influence on the trait.
Advantages for carrot breeding • Dominant resistance: markers can distinguish homozygous and heterozygous resistant plants • Recessive resistance: markers can distinguish heterozygous and homozygous susceptible plants • Combine resistance genes
Advantages for carrot breeding • Molecularmarkers provideanadditional tool forbreedersto select fortheirtraits of interest. • Selectionwith markers canbedone at any stage withany part of the plant • New possibilitiesto combine traits of interest tocreate even bettercarrots