Download
1 / 13

E N D
1. One Factor-at-a Time (OFAT) Vs. Designed Experiments
2. �Tradition� vs. Modern Historically Engineers and Scientists perform OFAT Experiments: Vary only one variable (factor) at a time while holding others constant
Statistical DOE is modern approach with many benefits. In combination with Statistical Process Control (SPC) it is required by ISO9000 for quality control
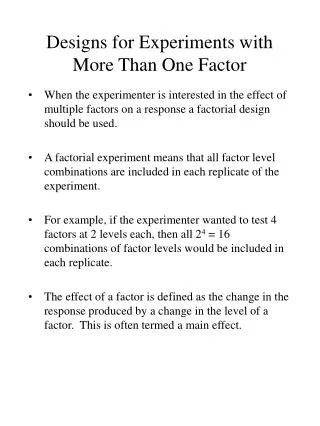
3. Advantages of DOE over OFAT Requires less resources (experiments, time, material, etc.) for the amount of information obtained
Estimates of the effect of each factor are higher in precision (less variability)
The interaction between factors can be estimated systematically- �hit and miss� experiments usually do not estimate interaction.
4. Advantages of DOE over OFAT Experimental information is in a larger region of the factor space
Improves prediction of the response in the factor space by reducing variability
Makes process optimization more efficient because optimal solution is searched for over the entire factor space
5. Example 1: Two factors in Three runs Engineer plans to compare T and P for a Standard gas anneal process on silicon wafers, and a New gas anneal process using three experimental runs:
1) Standard P and standard T
2) Standard P and new T
3) New P and new T
6. Initial (OFAT) Plan Use one lot of 48 wafers
16 wafers will be used for each of the three experimental runs (48 / 3 = 16)
7. OFAT Method
8. OFAT Method Standard T is compared to new T using 16 + 16 = 32 wafers at the standard P
Standard P is compared to new PT using 16 + 16 = 32 wafers at the standard T
The interaction between T and P (difference between effect of T on the response at the standard P and effect of T at the new P) cannot be estimated- no info at at new P with standard P)
9. Alternative: 22 Statistical Design Average is the main effect of Temperature, difference is interactionAverage is the main effect of Temperature, difference is interaction
10. Comparison of methods OFAT gives 16 comparisons of the temperature effects of going from the standard to the new pressure but DOE gives 12 + 12 = 24
Each method includes replicates. Replicates give less uncertainty, better estimation of error
11. Recap Comparison of methods Variance for estimates of effect of factors in DOE is 50% less than OFAT
Greater factor space is covered
Interaction can be estimated with DOE but not with OFAT
12. Other Designs
13. Contour plot (model) of central composite
14. Further Study. . . Use these example and others in handout for more explanation
Examine tutorials and help menu topics in Design Expert to learn more about designs and how to use software
Check out Stat-Ease web sight for FAQ�s, ideas for simple experiments, etc.
Ask me for help when you need it