Download
1 / 23
230 likes | 238 Views
Explore a study on mapping the African Great Lakes region using daily VEGETATION data, focusing on interpreting VGT time series data challenges and comprehensive use of multispectral, temporal, and spatial information. The study area spans 4°N-14°S / 25°E-35°E, covering 2.257.920 Km² and addresses specific challenges like clouds, topography, and the inversion of seasonality. Classification methods and validation processes are detailed, offering insights into mapping primary and secondary forests, roads, and trees. Conclusions highlight an automatic methodology of mapping with high local contrast and broad applicability.

E N D
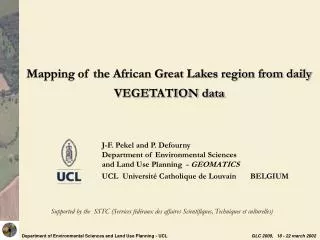
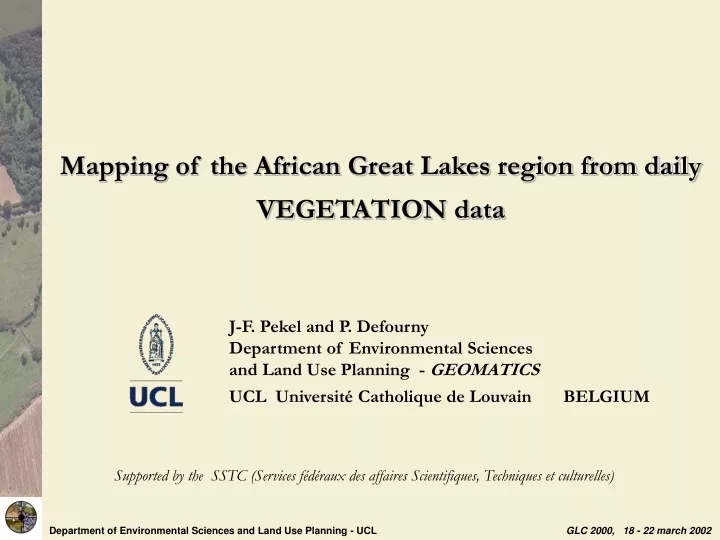
Department of Environmental Sciences and Land Use Planning - UCLGLC 2000, 18 - 22 march 2002 Mapping of the African Great Lakes region from daily VEGETATION data J-F. Pekel and P. Defourny Department of Environmental Sciences and Land Use Planning - GEOMATICS UCL Université Catholique de Louvain BELGIUM Supported by the SSTC (Services fédéraux des affaires Scientifiques, Techniques et culturelles)
Department of Environmental Sciences and Land Use Planning - UCLGLC 2000, 18 - 22 march 2002 • Main challenge for VGT time series data interpretation • How to use simultaneously : • multispectral information • temporal information • full spatial resolution consistency
Study area Window: 4°N-14°S / 25°E-35°E Area: 2.257.920Km² Department of Environmental Sciences and Land Use Planning - UCLGLC 2000, 18 - 22 march 2002
Particularities of the study area 09 07 11 10 08 13 09 15 16 12 14 Department of Environmental Sciences and Land Use Planning - UCLGLC 2000, 18 - 22 march 2002 • Clouds and large gaps 06 may 2000 (Blue, Red, NIR)
Particularities of the study area Department of Environmental Sciences and Land Use Planning - UCLGLC 2000, 18 - 22 march 2002 • Topography
Particularities of the study area Department of Environmental Sciences and Land Use Planning - UCLGLC 2000, 18 - 22 march 2002 • Inversion of seasonality Spatial consistency ? 3 july 2000 (R, PIR, MIR) 6 mars 2000 (R, PIR, MIR)
Compositing Department of Environmental Sciences and Land Use Planning - UCLGLC 2000, 18 - 22 march 2002 1st Strategy:Manual compositing
Compositing Department of Environmental Sciences and Land Use Planning - UCL GLC 2000, 18 - 22 march 2002 2nd Strategy:Mean compositing Annual
Compositing Department of Environmental Sciences and Land Use Planning - UCL GLC 2000, 18 - 22 march 2002 2nd Strategy:Mean compositing Feb-March-April July-August-September Annual
Classification methodology R Seasonal mean (Feb-March-April) NIR MIR Mean reflectance per class R NIR MIR Seasonal mean (July-August-September) Department of Environmental Sciences and Land Use Planning - UCLGLC 2000, 18 - 22 march 2002 Classification (50 classes) Annual mean
Classification Department of Environmental Sciences and Land Use Planning - UCLGLC 2000, 18 - 22 march 2002 R NIR MIR Classification (17 classes) Mean reflectance per class R NIR MIR
Labelling Department of Environmental Sciences and Land Use Planning - UCLGLC 2000, 18 - 22 march 2002 Classe 1: forêt dense humide semprevirente et semi-décidue Classe 2: forêt dense humide semi-décidue Classe 3: forêt ombrophile secondaire
Labelling Department of Environmental Sciences and Land Use Planning - UCLGLC 2000, 18 - 22 march 2002
Validation: visual comparison Department of Environmental Sciences and Land Use Planning - UCLGLC 2000, 18 - 22 march 2002 Landsat TM (Nir, MIR, Green) Classification result of VEGETATION data
Validation: visual comparison Department of Environmental Sciences and Land Use Planning - UCLGLC 2000, 18 - 22 march 2002 Classification result of VEGETATION data Landsat TM (Nir, MIR, Green)
Validation: visual comparison Department of Environmental Sciences and Land Use Planning - UCLGLC 2000, 18 - 22 march 2002 Landsat TM (Ni r, MIR, Green) Classification result of VEGETATION data
Validation: visual comparison Department of Environmental Sciences and Land Use Planning - UCLGLC 2000, 18 - 22 march 2002 Landsat TM (Nir, MIR, Green) Classification result of VEGETATION data
Validation: visual comparison Department of Environmental Sciences and Land Use Planning - UCLGLC 2000, 18 - 22 march 2002 Classification result of VEGETATION data Landsat TM (Nir, MIR, Green)
Validation: visual assesment Department of Environmental Sciences and Land Use Planning - UCL GLC 2000, 18 - 22 march 2002 Primary forest Secondary forest Roads
Validation: visual comparison Department of Environmental Sciences and Land Use Planning - UCLGLC 2000, 18 - 22 march 2002 Classification result of VEGETATION data TREES map
Validation: visual comparison Department of Environmental Sciences and Land Use Planning - UCLGLC 2000, 18 - 22 march 2002 Classification result of VEGETATION data Landsat TM (Nir, MIR, Green) TREES map (2000)
Validation: visual comparison Department of Environmental Sciences and Land Use Planning - UCLGLC 2000, 18 - 22 march 2002 Classification result of VEGETATION data Landsat TM (Nir, MIR, Green) TREES map (2000)
Conclusions Department of Environmental Sciences and Land Use Planning - UCL GLC 2000, 18 - 22 march 2002 • Automatic and operational methodology of mapping • Use of all reflectance channels and not only the NDVI • High local contrast between land cover types • Mean compositing provides a large spatial consistency • Methodology based on phenology • Methodology most probably applicable to many areas and various conditions