Download
1 / 33
350 likes | 414 Views
Arithmetic vs. Geometric Mean. Chapter 10 (continued). Arithmetic average – return earned in an average period over multiple periods Arithmetic average, R A = (R 1 + R 2 +… + R T ) / T

E N D
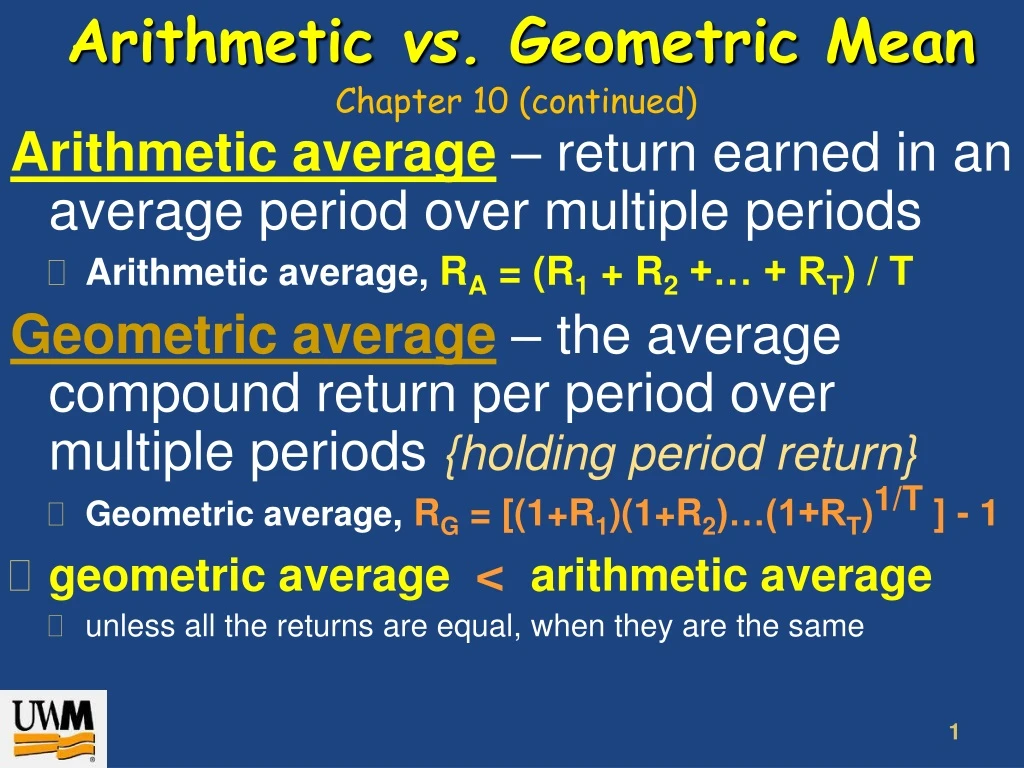
Arithmetic vs. Geometric Mean Chapter 10 (continued) Arithmetic average – return earned in an average period over multiple periods • Arithmetic average, RA = (R1 + R2 +… + RT) / T Geometric average – the average compound return per period over multiple periods {holding period return} • Geometric average, RG = [(1+R1)(1+R2)…(1+RT)1/T]- 1 • geometric average < arithmetic average • unless all the returns are equal, when they are the same
Geometric Average Return: Formula Equation 10.4 Where: Ri = are the returns in each period T = the number of periods
Average & Geometric Returns • What is the arithmetic and geometric average for the following returns? Year 1 5% Year 2 -3% Year 3 12% • Arithmetic average = (5 + (–3) + 12) /3 = 4.67% • Geometric average = [(1+.05)*(1-.03)*(1+.12)]1/3 – 1 = .0449 = 4.49% RA > RG
Which is Better? • The arithmetic average is overly optimistic for long horizons • The geometric average is overly pessimistic for short horizons • So the answer depends on the planning period under consideration. The book suggests: • 15 – 20 years or less: use arithmetic • 20 – 40 years or so: split the difference between them • 40 + years: use the geometric • Prof Marcus likes GEOMETRIC as reflecting what your holding period return was regardless the time horizon.
My Favorite Extreme Example • Invest $1,000 and hold for 2 years. What was your annual return if you lose 50% in first year and then gain 100% in the second year? Arithmetic return = (-50% +100%)/2 = 25% Geometric return = (.5)(2).5 – 1 = 0% • If invest $1000, then at end of year 1 have only $500, and by end of year 2 have $1,000. • Which reflects my true holding period return?
Finding Fund Volatility • How volatile are mutual funds? • Morningstar provides information on mutual funds, including 3, 5, & 10 yr. standard deviations • Click on the link the Morningstar site • Pick a fund, such as the Fidelity Advisor Growth & Income Fund (FGIRX) (with 2 stars) • AlsoT. Rowe Price Mid-Cap Growth (RPMGX) (with 5 starsover 3, 5, and 10 years) • Enter the five letter ticker in the “Quote” box click then click on “Risk” http://www.morningstar.com/
Return Variability Review and Concepts • Normal distribution: • A symmetric frequency distribution • The “bell-shaped curve” • Completely described by the mean and variance • Does a normal distribution describe asset returns? • Truncated distribution at -100%, so skewed to the right
Problem • Your stock investments return 8%, 12%, and -4% in consecutive years. What is the arithmetic return? • Mean = ( .08 + .12 + -.04) / 3 = .0533 • What is the geometric return? • Geometric (1.08 x 1.12 x .96).3333– 1 = .0511 • What is the sample standard deviationof the above returns? • Variance = {(.08-.0533)2 + (.12-.0533)2 +(-.04-.0533)2}/(3-1) = .00693 so Standard deviation = √.00693 = .0833
Efficient Capital Markets The Efficient Market Hypothesis (EMH): • Stock prices are in equilibrium • Stocks are “fairly” priced • Informational efficiency • If true, you should not be able to earn “abnormal” or “excess” returns • Efficient markets DO NOT imply that investors cannot earn a positive return in the stock market
Forms of Market Efficiency • Strong-form Efficient Market: Information = Public or private “Inside information” is of little use • Semistrong-form Efficient Market: Information = publicly available information Fundamental analysis is of little use • Weak-form Efficient Market: Information = past prices and volume data Technical analysis is of little use
1. Strong Form Efficiency • Prices reflect all information, including public and private • If true, then investors cannot earn abnormal returns regardless of the information they possess • Empirical evidence indicates that markets are NOT strong form efficient • Insiders can earn abnormal returns (may be illegal)
2. Semistrong Form Efficiency • Prices reflect all publicly available information including trading information, annual reports, press releases, etc. • If true, then investors cannot earn abnormal returns by trading on public information • Implies that fundamental analysis will not lead to abnormal returns
3. Weak Form Efficiency • Prices reflect all past market information such as price and volume • If true, then investors cannot earn abnormal returns by trading on market information • Implies that technical analysis will not lead to abnormal returns • Empirical evidence indicates that markets are generally weak form efficient
Efficient Market Hypotheses STRONG Public & Private Information WEAK Security Market Information SEMISTRONG Public Information
Common Misconceptions about the Efficient Market Hypothesis • EMH does not mean that you can’t make money • EMH does mean that: • On average, you will earn a return appropriate for the risk undertaken • There is no bias in prices that can be exploited to earn excess returns • Market efficiency will not protect you from wrong choices if you do not diversify – you still don’t want to put all your eggs in one basket
Midterm 2 • Thursday, November 7thin our classroom N146 at our regular time period. • Bring financial calculator (BYC) • Bring a pencil • 40 multiple choice questions for 80 points. • Chapters 6 – 10. • 8 questions per Chapter • Come 10 minutes early
Chapter 6 – 8 bond questions • What are discount, premium, and par bonds? • Find the price, YTM, length, or coupon of a bond, given other information • What is price risk and reinvestment risk? • Types of Government bonds (bills, notes, bonds) • What are bond ratings? • What are zero coupon bonds? • What are floating rate bonds? • What is a bond indenture? • What is the Fisher Effect? • What is the term structure of interest rates?
Some Bond Questions • Does a 30 year bond have more PRICE risk or more REINVESTMENT risk than a 5 year note? • Does a zero-coupon 10 year bond have more PRICE risk or more REINVESTMENT risk than a 10 year 5% coupon bond? PRICE risk. Again, PRICE risk as all of the money comes at the end of 10 years.
Chapter 7 – 8 equity questions • What is the value of a share of stock? • What is the value of stock with no growth in dividends? • What is the Dividend Growth Model? If given dividends and growth of dividends and the required return, can you find the price? • Find the price of a stock that has dividends growing at a nonconstant rate. • What is a preferred stock? How is it priced? • What are some features of common stock? • How has electronic communications networks allow for more efficient markets?
Some Stock Questions • With dividends growing at 4%, the required return is 10% and the most recent annual dividend was $1, what is the price of the stock? • The last annual dividend was $2 and the required return is 12%. If dividends grow 20% this year, but all future years after that grow at 5%, what is the price of the stock next year? Use the Dividend Growth Model: P = 1(1.04) / (.10 - .04) = 1.04/.06 = $17.33. Find the divided in 2 years: D2 = 2(1.2)(1.05) = 2.52, so P1 = 2.52 / (.12 - .05) = $36. Not asked, but to find the price of the stock today, it would be: P0 = [D1 + P1]/(1 + R) = [2.40 + 36.00]/1.12 = $34.29.
Chapter 8 – 8 NPV/IRR questions • Find the NPV. When do we accept a project? • Find the Payback Period. When do we accept a project? • Find the Discounted Payback Period • Find the Average Accounting Return • Find the Internal Rate of Return. When do we accept a project? • IRR with nonconventional cash flows and IRR with mutually exclusive projects • Find the MIRR#1. Find profitability index, PI.
Some Capital Budgeting Questions • Find the IRR of a project with an initial outlay of -200 and cash flows in the next two years of +250 and +50. • What is the NPV of the project above at a required return of 12%? • If the project above has a negative CF03 of -20, how would you do the MIRR#1? IRR = 42.539% NPV = $63.07 Put -20/(1.12)^3 into the initial outlay, or have the initial outlay be -214.236.
Chapter 9 – 8 investment decisions • What cash flows to include and exclude • Creating pro forma income statements • Finding OCF and CFFA • What to do with Net Working Capital? • What to do with Net Salvage Cash Flows? • Scenario Analysis • Sensitivity Analysis • Simulation Analysis • Managerial Options • Capital Rationing & Profitability Index
Question on Investment Decisions What is the NSCFof an asset sold at the end of year 3 for $4,000 if the tax rate is 21%? Answer: 4000 - .21[4000 – 3456] = $3,885.76 You had to pay $114.20 in taxes for excessive depreciation.
Chapter 10 – 8 capital market questions • Percentage and dollar returns (dividend yield + capital gains yield) • Historic returns by asset classes, which had the greatest return? Which is most risky? • Calculate both the Arithmetic versus Geometric returns. Which is larger? • What are the three forms of market efficiency? • How would stock prices react in an efficient market versus one that either under or over reacts.
Questions on Chapter 10 • What is the geometric return over these years? • What is the arithmetic return? • What is the standard deviation over these years? (1.12)(1.2)(1.07)^.3333 = 1.1288 -1 = 12.87% 39%/3 = 13% Variance = { (12-13)^2 + (20-13)^2 + (7-12)^2 }/2 = 75 / 2 = 37.5. Standard Deviation is the square root of the variance at 6.1%.
From Before Midterm 1 Operating CF = OCF= EBIT + Depreciation – Taxes NCS = ending net fixed assets – beginning net fixed assets + Depreciation Changes in NWC = ending NWC – beginning NWC Net Working Capital = NWC = CA - CL Cash Flow From Assets (CFFA) = Cash Flow to Creditors + Cash Flow to Stockholders = (Interest paid – net new borrowing) + (dividend – net equity raised) CFFA = Operating Cash Flow (OCF) – Net Capital Spending (NCS) – Changes in NWC = (OCF) – (end FA – begin FA + depreciation) – (end NWC – begin NWC) Current Ratio = CA/CL Equity Multiplier, EM = TA / TE = 1 + D/E = ( 1 + Debt-Equity Ratio ) Total Asset Turnover, TAT = Sales / TA Profit Margin, PM = Net Income / Sales = NI / Sales Return on Assets, ROA = NI / TA Return on Equity, ROE = NI / Total Equity P/E Ratio = Share price / earnings per share Market to Book Ratio = Share price / Book value per share
PV = FV/(1 + r)t = FV·PVIF and FV = PV(1 + r)t = PV·FVIF Perpetuity: PV = C / r Annuity: PV = (C/r)·[ 1 – 1/(1+r)t ] and FV = (C/r)·[ (1+r)t - 1 ] EAR = ( 1 + APR/m)m – 1 ) where m is the number of compounding periods per year APR = rate per period times number of periods per year (e.g., if you knew the quarterly rate is r, then APR = 4*r; or 12*r if r is the monthly rate) EAR = eAPR – 1 for continuously compounding Du Pont Identity: ROE = PM * TAT * EM Internal rate of growth using only retained earnings g = ROA·b / [ 1 - ROA·b ] b = plowback (or retention) ratio = 1 – p = 1 – payout ratio Sustainable growth rate with constant debt ratio, g = ROE·b / [ 1 - ROE·b ]]
For Midterm 2 Bond Value = (C/r)·[ 1 – 1/(1+r)t ] + F/ (1+r)t PV = -price of bond; N=periods; PMT=coupon payment; FV=+1,000 CPT I/Y is yield to maturity. Watch out for semiannual or annual. Fisher Effect: (1 + R) = (1 + r)(1 + h), R is nominal, r is real, and h is inflation rate. Share price with no dividend growth: P0 = D / r DGM: Dividend growth model: P0 = D0 (1+g) / (R-g) = D1 / ( R- g) Required Return R = D1/P0 + g NCF = (Revenue – Cost – Dep) (1 – T) + Dep NPV = PV( expected future NCFs ) – Initial Outlay IRR: Is the rate, r, which solves: Initial Outlay = SNCFt/ ( 1 + r )t MIRR#1 = bring all negative future cash flows to the present using the discount rate and find IRR for projects with nonconventional CFs. AAR = Average net income / Average Book Value Profitability Index= PV ( expected future net cash flows) / | Initial Outlay | --- formula is next slide in bottom corner box.
For Midterm 2 • Depreciation Tax Shield = D·T NSCF: Net Salvage CF = selling price – T·(selling price – book value) • Total Percentage Return = Div Yld + Cap Gains Yld = D1/P0 + (end price – begin price)/P0 • Arithmetic average = (R1 + R2 +… + RT ) / T • Geometric average = [(1+R1)(1+R2)…(1+RT)]1/T– 1 Note that if R = 8%, then 1+R = 1.08. • Expected return E( R ) = S pi Ri and for a sample, this is the arithmetic average • Sample Variance s2 = S (Ri – E( Ri ))2 / (N-1) • Standard Deviation = Square root of sample variance • 68% of the time, mean + 1 s • 95% of the time, mean + 2 s • 99% of the time, mean + 3 s