Download
1 / 25
250 likes | 355 Views
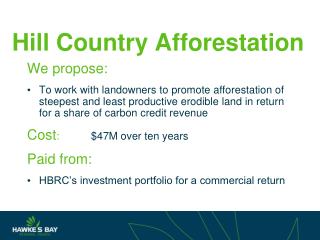
Effects of variability in fertiliser application on hill country production economics. Allan Gillingham (Research Consultant) Alister Metherell . Hill pastures . All hill country is variable This means differences in pasture growth potential Often in complex patterns.

E N D
Effects of variability in fertiliser application on hill country production economics Allan Gillingham (Research Consultant) Alister Metherell
Hill pastures • All hill country is variable • This means differences in pasture growth potential • Often in complex patterns
“Lost” pasture production can occur in two ways:- • The same rate of fertiliser being applied to different production zones • Variation in fertiliser application rate within a zone
Factors affecting “lost” production • Fertiliser application rate factors • Land productivity, and initial nutrient status • Fertiliser residual properties
What causes variability in application rate • Swath shape • Discharge rate • Track spacing • Cross wind / altitude • Aircraft speed
Estimation of CV% • Usually use a single swath shape and overlap this at a range of track spacings
To date the accuracy of track spacing has depended on pilot skill and experience • Now GPS increasingly being used for guidance and job record
Results show that even with GPS track spacing CV% may be up to 33%.eg 15m ± 5m • Difficult to estimate without GPS Assume CV = 66% ?
Variability in discharge along the flight path also varies • For superphosphate – Helicopter CV % = 12-27 - Fixed wing CV % = 37-67 • What effect does this have on spread CV% estimates?
Effects of variations in aircraft altitude and speed, and in cross wind not included in this evaluation
What are the effects of land productivity and initial nutrient (P) status? • eg “High” (stocking rate =20/ha; Olsen P =30) “Medium” (SR = 19; P =15) “Low” (SR = 4; P =8)
Probability of fertiliser application rate occurring on any one site estimated by @Risk analysis. • Effects of variability in fertiliser application rate on soil P and productivity assessed by OVERSEER analysis
Selected swath shape • Cresco with superphosphate
Random variation • Added random variation in track spacing of up to 33 or 66% and variation in flow rate of 50%
Results: Fertiliser application rate and Soil Phosphate
Variation in fertiliser application rate with 66% variation in 12m track spacing
Variability of overall spread(CV%) • 33% track error = 30 • 33% track plus 50% flow error= 42 • 66% track error = 48 • 66%track plus 50% flow error = 58
Soil P test distribution with 66% variation from 12m track spacing
Results • Pasture dry matter production
Effect of variability in fertiliser application rate on pasture DM production Even Spread Mean ±1 S.D. 95% 5%
Results • All scenarios showed less than 1% depression in long term (10 yr) mean pasture DM production due to variability in P fertiliser application rate
Conclusions Variability in fertiliser application rate has little effect on average pasture production because of- • Compensating random rate effects • High residual properties of P fertiliser
Conclusions • These results differ from situations where exactly the same pattern of P application occurs at every application • This is unlikely to occur in hill country
Nitrogen • Straight line response • Little effect of variability in fertiliser rate on pasture response
Thank you