Download
1 / 28
280 likes | 304 Views
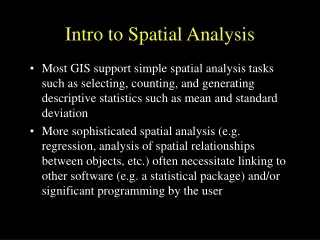
Learn about spatial analysis methods, explore spatial data with maps and graphs, compute with GIS tools, interpret and communicate results effectively.

E N D
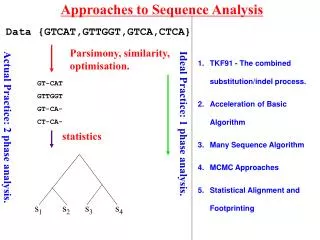
Approaches to Spatial Analysis Flora Vale, Linda Beale, Mark Harrower, Clint Brown Esri Redlands
Analysis (noun) Detailed examination of the elements or structure of something, as a basis for discussion, interpretation, and action Examine, Investigate, Inspect, Survey, Study, Scrutinize, Explore, Probe, Research, Review, Evaluate, Interpret
Two Key Methods for Spatial Analysis • Spatial Data Exploration • Spatial Problem Solving
Spatial Data Exploration Working with Maps and Graphs • Smart Mapping enables you to explore and interact with your data …
Spatial Data Exploration Working with Maps and Graphs • Interactive Charting and Graphing your Tabular Data and Real-time Feeds Explore and Discover
Approach To Spatial Problem Solving Modeling accompanied by Exploration and Interpretation … followed by Map-based Communication 1. Ask 5. Share 2. Compute 4. Decide 3. Interpret
1. Pose a Question Scope and frame your question Explore your data Scope the problem and frame your question Examples: Identify the best path for a wildlife corridor Is there a difference in Medicare expenditures per capita across the country? Where? Is there a pattern in these crime data? By location? By time?
2. Model and Compute Compute with data. Apply a logical sequence of spatial processing operations to generate a desired set of results Python
2. Model and Compute Compute with data. Apply a tool to transform existing data into new results GIS Tool Tool Result Dataset Apply an operation to your data to generate a result
GeoprocessingString tools together to create your own “programs” • Feed the results of one tool into another tool • Program your ideas with Python, Model Builder, Insights, … Result 2 Dataset 1 Dataset 2 Result 1 Tool 1 Tool 2
3. Explore and Interpret Often a Missing Step The Analysis Step • Express your results as information products • Maps • Reports • Information Popups • Charts and Graphs • Etc. • Explore, examine, and interpret these results
4. Make a Decision Draw your conclusions and document your results
5. Communicate and Share • Present your results • Communicate with Maps, Summaries, Charts and Graphs, Workbooks, and Narratives • Share your conclusions and understanding with others as useful map-based information products Storymaps
Two Key Methods in Action • Spatial Data Exploration • Spatial Problem Solving
Flora Vale Spatial Analyst, Esri Health (Medicare) data and crime incidents Exploratory Data Analysis
Spatial Analysis what my mom thinks I do what society thinks I do what my friends think I do what I actually do what I think I do
Charts in ArcGIS Pro Distributions HISTOGRAM – group numbers into bins to visualize distribution Relationships SCATTER PLOT – plot two numeric variables to visualize their relationship Categories BAR CHART – compare amounts across different categories Change LINE CHART – visualize change over a continuous range, such as time or distance
Linda Beale Data Scientist, Esri and be fun Data exploration can lead to insights
Mark Harrower GIS Designer, Esri Observations
Reflections and Future Directions Interactive visualization and analysis go hand-in-hand (not either or) Smart defaults will help, but no magic bullets, need to ask good questions & expertise Introduce the power of analytics to new audiences Spatio-temporal is a major focus – people interested in processes, not static states. Lots of good time series methods (e.g., emerging hotspots) AND richer data available. June release ArcGIS Online great new temporal visualizations = formulate hypothesis
Spatial Problem Solving Often Leads to New Questions A Repeatable, Iterative Process 1. Ask Again 5. Share 2. Compute 4. Decide 3. Interpret