Download
1 / 14
140 likes | 242 Views
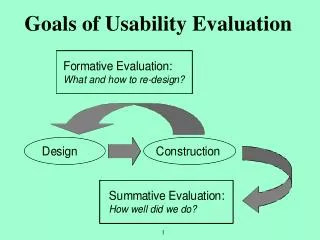
Usability and Evaluation. Motivations and Methods. Motivations. Define a metric for performance of users when using new tools, interfaces, visualizations etc. Verify scientific, innovative contributions. Reduce cost of redesigning a new product. . Ideal.

E N D
Usability and Evaluation Motivations and Methods
Motivations • Define a metric for performance of users when using new tools, interfaces, visualizations etc. • Verify scientific, innovative contributions. • Reduce cost of redesigning a new product.
Ideal • Come up with theories like Fit’s Law so we won’t need to run user studies at all
Performance • New tools, user interfaces (graphical or not), visualizations require users to: • perceive, • interpret and • execute tasks. • Performance is measured in: • Time • Accuracy • Recall • Satisfaction
Overlaps • Cognitive Psychology: the study of how people think, perceive, remember, speak and solve problems. Adopts a very empirical, scientific study method. • Cultural and Social Anthropology: investigates effects of social and cultural norms on individual behavior. Field studies is a common research method. • Schools of Information (iSchools), Graphic Design, Communications, Marketing
Usability in HCI • Very empirical: carefully designed controlled experiments. Has to be designed to verify a hypothesis. Hypothesis: “Users will outperform in executing task T when they use technique A instead of technique B”
Task • Thy your user ! • Thy your task ! • Most complicated tasks are a culmination of simple building block tasks. • Sorting documents: • Access individual documents (point, select, click) -> • read titles -> • categorize (re-label, change location etc)
Scenario Based Usability Tests • Let users achieve identified tasks in a convincing scenario! • Hard to achieve: • Nature of the controlled experiment requires as minimum uncontrolled variables as possible whereas a convincing scenario requires complexity.
Designing and Running an Experiment • Identify hypothesis • Identify tasks • Design your tool, interface, visualization after these stages or at least re-visit your initial design • Identify dependent and independent variables • Within vs between subjects designs • Randomization • Demographics
Evaluate the results of your evaluation • Statistical analysis • ANOVA • Chi-square tests • Regression • …
End of Controlled Studies • Limitations: how to measure enjoyment, creativity • “our tool let people discover new things … encourage them to try things that are not recommended by their friends…” • Alternatives: • Qualitative methods • Think-aloud protocols • Count a-ha! moments • Longitudinal studies • Interviews • Surveys • Focus Groups
Analyzing Qualitative Data • Easier to collect, harder to interpret • Quantitative analysis applied to qualitative data • http://www.atlasti.com
Reporting: Writing the Paper • Whatever you do, what is really important is how you present it. • A quantitative experiment is easier to report. • You have to make sure you don’t arrive at a “big” conclusion based on little evidence, little results. • On the other hand you have to emphasize importance of your findings.