Download
1 / 24
240 likes | 322 Views
SAVE your existing MS Project File at the end of PART3 as <username>_ PART4 WITH BASELINE . M ake sure you keep the original file without a baseline. If “Save with a baseline option” does not appear,. 1.Choose “Tools”. 3.Click on “SaveBaseline...”. 2.Select “Tracking”.

E N D
SAVE your existing MS Project File at the end of PART3 as <username>_PART4 WITH BASELINE. Make sure you keep the original file without a baseline. OPSM 639, C. Akkan
If “Save with a baseline option” does not appear, 1.Choose “Tools” 3.Click on “SaveBaseline...” 2.Select “Tracking” OPSM 639, C. Akkan
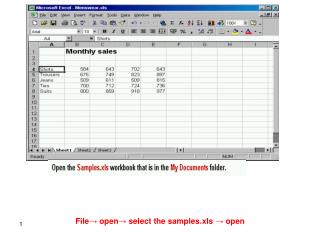
Monthly Cost Schedule Report-1 1.Select “View” 2.Choose “Report” OPSM 639, C. Akkan
Monthly Cost Schedule Report-2 1.Choose “Cost” 2.Click on “Select” 3.Select “CashFlow” 4. Click on “Edit” icon. OPSM 639, C. Akkan
Monthly Cost Schedule Report-3 1.Select “Definition” 3.Click “OK” 2.Select “Month” You can change the format and details of cost schedule report by changing the items within “Crosstab Report” view. For the monthly cost report change the time unit to months. OPSM 639, C. Akkan
Monthly Cost Schedule Report-4 Click on “Select” icon. OPSM 639, C. Akkan
Monthly Cost Schedule Report-5 Monthly Cost Schedule Report OPSM 639, C. Akkan
Update the Progress of the Project-1 Update data provided in Projectinfo_4.xls. 1.Select the activity that you will update 2. From “Tools” select “Tracking” 4.Update Tasks... OPSM 639, C. Akkan
Update the Progress of the Project-2 Change the durations using the data provided in the Excel file. Note: Although we changed the actual and remaining durations, baseline dates are not affected by changes you made. OPSM 639, C. Akkan
Update the Progress of the Project-3 If a number of tasks started and finished on time, you can set the actual finish information for all those tasks at once. Procedure as follows; Select the tasks that you want to update (press CTRL key and click on Task Name). OPSM 639, C. Akkan
Update the Progress of the Project-4 1.Go to “Tool” bar 2.Choose “Update Project...” 2.Select “Tracking” OPSM 639, C. Akkan
Update the Progress of the Project-5 Choose “selected tasks” then click “OK” OPSM 639, C. Akkan
Seeing the Effects of Update-1 1.Go to “View” 3.Select “Tracking Gantt” 2.Click “More Views” OPSM 639, C. Akkan
Seeing the Effects of Update-2 • Dark Blue Bar shows the completion percentage of the tasks. • Light Blue Bar shows the remaining percentage of the tasks. • Gray Bar shows the base line of the tasks. OPSM 639, C. Akkan
Seeing the Effects of Update on Critical Path Select “Critical” As you can see Tracking Gantt Chart does not show the completed tasks on the critical path. Therefore we have only remaining critical activities as indicated by the Red Bar. OPSM 639, C. Akkan
Earned Value Analysis Report-1 • What is earned value analysis? • Earned value analysis is a method for measuring project performance. It indicates how much of the budget should have been spent, in view of the amount of work done so far, and the baseline cost for the task, assignment, or resource. Earned value is also referred to as budgeted cost of work performed (BCWP). In our example we use the beginning of each month as a control date for the earned value analysis. OPSM 639, C. Akkan
Earned Value Analysis Report-2 1. From “Project” select “Project Information” 2.Set “Status date” to 5/1/2002 OPSM 639, C. Akkan
Earned Value Analysis Report-3 1.Select “View” 2.Choose “Report” 4.Click “Select” 3.Click on “Costs...” OPSM 639, C. Akkan
Earned Value Analysis Report-4 1.Select “Earned Value” 2.Click on “Select” OPSM 639, C. Akkan
Field Description BCWS Budgeted cost of work scheduled, through the project status date BCWP Budgeted cost of work performed, through the project status date ACWP Actual cost of work performed, through the project status date SV Earned value schedule variance, through the project status date CV Earned value cost variance, through the project status date BAC Budgeted at completion (the baseline cost of the task/project) EAC Estimate at completion, (estimated cost of the task/project) VAC Variance at completion, (=BAC – EAC) Fields in the Earned Value Table OPSM 639, C. Akkan
Earned Value Analysis Report-5-1 Cost calculations for activity 5:Uses 100% of resource B whose fixed cost is $450 & variable cost is $12/hr.BCWS = 450 + 13 (12*8) = $1698 BCWP = 450 + 13 (12*8)*(13/14) = $1608.86 OPSM 639, C. Akkan
Earned Value Analysis Report-5-2 • If BCWS is larger than BCWP, then that task is behind schedule. Hence there is a negative schedule variance. • Total ACWPis larger than BCWP;that is money spent on tasks performed has been larger than the budgeted amount. OPSM 639, C. Akkan
Earned Value Analysis Report-5-3 • EAC for activities that are not yet started (7, 8, 9, and 11) is set equal to BAC. • It is presumed that the fact that there has been deviations in the started activities does not necessarily mean that there will be deviations in the future activities. • EAC for activity 5 is calculated as follows: 450 + 14(12*8) = $1794 OPSM 639, C. Akkan
Save as your project as <username>-Part4-1 OPSM 639, C. Akkan