Download
1 / 10
110 likes | 336 Views
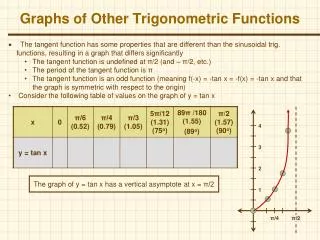
Other Types of Graphs. 2-3. Other Types of Graphs. In addition to the histogram, the frequency polygon, and the ogive , several other types of graphs are often used in statistics. They are the bar graph, Pareto chart, time series graph, and pie chart. . Bar graphs .

E N D
Other Types of Graphs • In addition to the histogram, the frequency polygon, and the ogive, several other types of graphs are often used in statistics. They are the bar graph, Pareto chart, time series graph, and pie chart.
Bar graphs When data is qualitative or categorical, bar graphs can be used to represent the data. It can be drawn using either horizontal or vertical bars.
Pareto Charts When the variable on the horizontal axis is qualitative or categorical, a Pareto chart can also be used to represent data.
Time Series Graphs • When data are collected over a period of time, they can be represented by a time series graph. When you analyze a time series graph look for trend or pattern that occurs over the time period.
The Pie Graph • Pie graphs are used extensively in statistics. The purpose of the pie chart is to show the relationship of the parts to the whole. A pie graph is a circle that is divided into sections or wedges according to the percentage of frequency
Misleading Graphs • Inappropriately drawn graphs can misrepresent the data and lead the reader to false conclusions. • Another way to misrepresent data on a graph is by omitting labels or units on the axes of the graph.
Misleading Graphs Differing scales and misrepresent data.
Misleading Graphs • All graphs should contain a source for the information presented. The inclusion of a source for the data will enable you to check the reliability of the organization presenting the data.
Stem and Leaf Plots • A data plot that uses part of the data value as the stem and part of the data value as the leaf to form groups or classes.